Environment
Our Approach to the Environment
Tokyo Electron aims to solve environmental issues through our leading-edge technology and services under the slogan of "Technology for Eco Life." We strive to contribute to the establishment of a sustainable society by reducing our impact on the consumption of resources, on biodiversity, and on climate change by taking actions that both directly and indirectly contribute to the protection and conservation of the environment.
September 25, 1998 Established
July 1, 2016 Revised
- Environmental Goals and Continuous Improvement
- We establish environmental goals and continual improvement of the environmental management system to enhance environmental performance throughout our product lifecycle.
- Compliance with Applicable Laws
- We continually enhance our knowledge of environmental issues to not only comply with applicable laws, but also set additional voluntary standards.
- Environmental Contribution with Product
- We develop environmentally complimentary products through our leading-edge technology. TEL cooperates with our customers and suppliers to strive for the prevention and improvement of environmental impacts to contribute to a sustainable society.
- Operational Environmental Impact Reduction and Preservation
- We quantitatively analyze and reduce the environmental impact of TEL global operations, with activity from all levels of employees and operations to prevent pollution and protect the environment.
- Collaboration and Cooperation with Stakeholders and Society
- We actively promote collaboration and cooperation with all our stakeholders to achieve mutual understanding and conformance to expectations.
Based on the above-mentioned policy, we strive to reduce the environmental impacts on the entire value chain of the product lifecycle (planning, development, designing, procurement, manufacturing, logistics, use by customers, maintenance services, and disposal of products). In addition, the lifecycle of our products covers the time they are at suppliers we procure from, contractors used for development, manufacturing, and logistics, and customers the products have an environmental impact at. We strive to conduct due diligence by grasping potential environmental risks when we engage in M&A or newly enter projects. The above-mentioned policy is being implemented based on decisions made by the CEO and corporate directors in charge acting as highest decision-makers, and decisions are reflected onto management. Furthermore, this environmental policy is communicated both internally and externally to inform stakeholders and business partners of our company’s approach to environmental initiatives and to encourage their understanding of and cooperation in our activities.
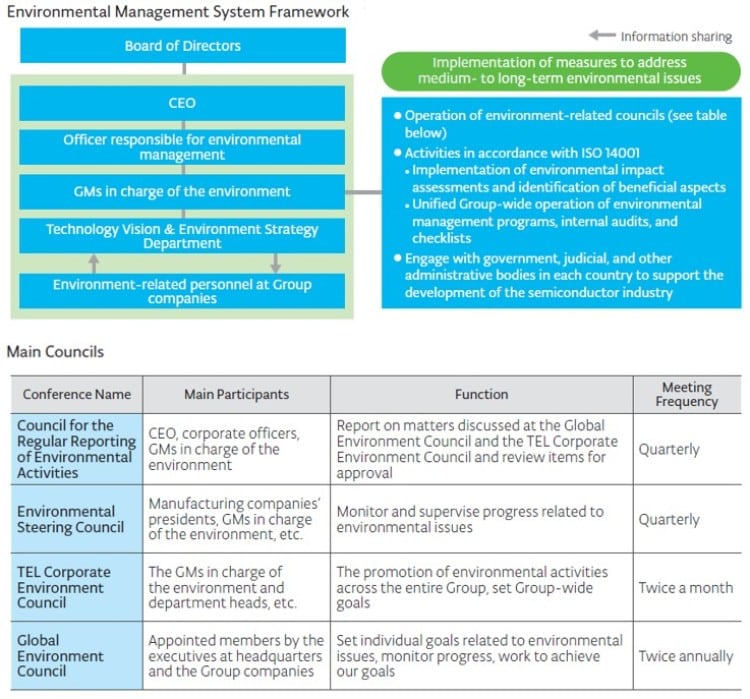
As the importance of environmental action continues to grow, we monitor and oversee progress on our initiatives to address environmental issues through the Council for the Regular Reporting of Environmental Activities and at the Environment Steering Council, both of which include the CEO and the executive officer in charge of the environment at headquarters. This allows us to meet the environmental and ESG requests we receive from customers and other stakeholders and to drive our activities over the medium- to long- term. We have also established the Technology Vision & Environment Strategy Department at headquarters, headed by the General Manager in charge of the environment, to promote environmental activities across the Group.
The Environment Council, made up of members appointed by the executives of the Group companies, sets targets related to environmental issues, monitors progress and also works to achieve its goals.
Furthermore, to continuously promote our environmental activities, we began operation of an environmental management system based on ISO 14001 since fiscal year 1998, primarily at our manufacturing subsidiaries. In March 2017, we obtained ISO 14001 certification for the entire Group, which had previously been obtained at each plant and office in Japan. In accordance with this certification, we have identified environmental impact assessments and useful environmental aspects and are executing a standardized Group format for environmental management programs and internal audit checklists. Continuing from the last fiscal year, we implemented improvement activities to achieve a total of approximately 100 environmental goals established for different levels as part of a Group-wide environmental management. Any issues identified through these activities are reviewed by the Global Environment Council and reported to the Environment Steering Council. To comply with national environmental regulations, which are revised frequently, we are also gathering information earlier on rules covering PFAS* and similar substances so that we can respond proactively. We were once again free from environmental incidents, violations, and legal proceedings in fiscal year 2026.
*PFAS: Per and Poly Fluoroalkyl Substances. This is the collective term for perfluoroalkyl and polyfluoroalkyl compounds, a subset of organic fluorine compounds.
ISO 14001:2015 Certification Status
| Company Name | Plant/Office name | Certification Number | Certification Date | Update Date |
|---|---|---|---|---|
| Tokyo Electron | Technology Vision & Environment Strategy Department (Fuchu Technology Center) | 1124-1998 -AE-KOB-RvA | May 1998 | Mar. 2026 |
| Tokyo Electron Technology Solutions | Fujii Office/Hosaka Office/Tohoku Office | |||
| Tokyo Electron Kyushu | Koshi/Ozu Office | |||
| Tokyo Electron Miyagi | Taiwa Office | |||
| Tokyo Electron(Kunshan) | — | 130755-2013-AE-RGC-RvA | Mar. 2013 | Mar. 2025 |
| TEL Manufacturing and Engineering of America | Chaska Office, North Chelmsford Office |
EMS586278 | Mar.2013 | Feb. 2025 |
| Tokyo Electron Korea | TEL Technology Center Korea, Balan Factory | ESC2795 | Jul. 2014 | Aug. 2026 |
| Tokyo Electron Taiwan | Hsinchu head office | C840754 | Apr. 2026 | Apr. 2026 |
E-COMPASS
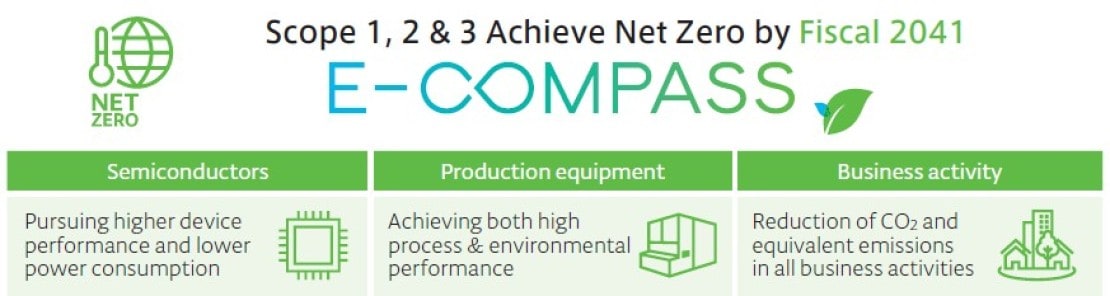
As a leading company in the semiconductor production equipment, we are rolling out the E-COMPASS (Environmental Co-Creation by Material, Process and Subcomponent Solutions), an environment-focused initiative. Through E-COMPASS, we work together with our customers and partner companies to promote semiconductor technological innovation and reduce the environmental impact of semiconductors through our business activities, centering on the three perspectives of semiconductors, production equipment, and business activities. We will supply products and services with technological and social value through our entire supply chain, led by E-COMPASS, and will link this to sustainable growth.
Initiatives with Suppliers
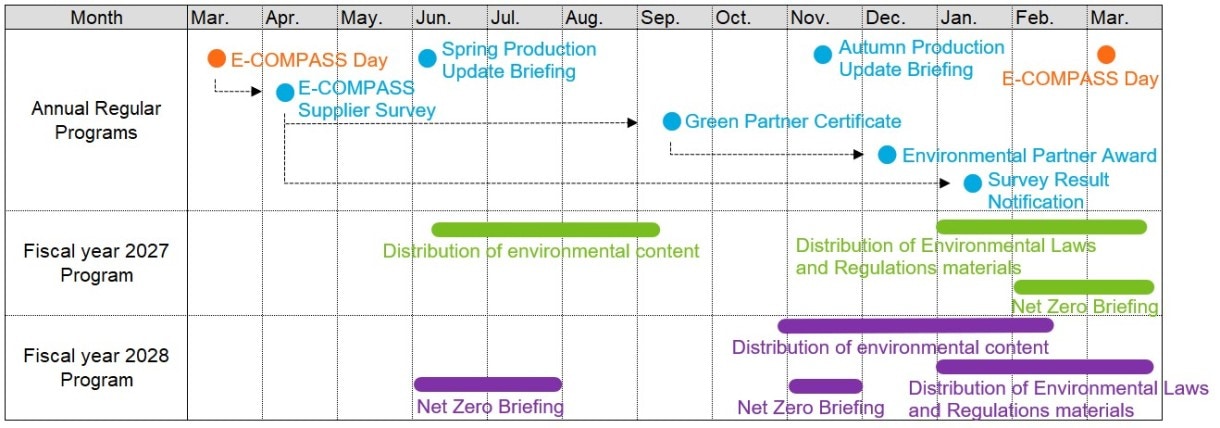
We believe we must accelerate our efforts even more to preserve the global environment and the data-driven society, which will be a growing reality in the years ahead. Five years have passed since we began our E-COMPASS activities and awareness about this initiative among many of our suppliers has increased. To further advance our net zero initiatives with suppliers, we share milestones with them and hold briefings focused on net zero. In recognition of these efforts, we were named to the A List, the highest rating, in the Supplier Engagement Assessment run by the non-governmental organization CDP*. To enhance collaboration with our suppliers even further, we will publish our annual schedule and effectively implement a range of events.
A non-governmental organization (NGO) established in the U.K. that surveys private companies and local governments on climate change and water resource management and publishes the results.
TEL E-COMPASS Day 2026
TEL E-COMPASS Day 2026, a briefing session devoted to the environment, was held in March 2026 in a hybrid online and in-person format and was attended by 539 participants from suppliers. At the session we presented the progress of our E-COMPASS activities and our net zero initiatives. We also showed a educational video covering the basics of environmental issues and a video in which an outside instructor gave a clear account of the process from calculating GHG emissions through to reducing them, and we explained the selection criteria for Environmental Partners and Green Partners, focusing on the points we consider most important. In addition, we held a reception for the roughly 50 participants from suppliers who attended in person, which proved a valuable opportunity to share challenges and build closer relationships.
For details, see our Corporate Blog.
Measures to Reinforce Partnerships
To strengthen our partnerships, we monitor the environmental activities of each supplier and award partner certifications according to their achievement. Through the measures below, we recognize and share outstanding efforts and build closer collaboration with our suppliers.
- Under a program that certifies suppliers with outstanding environmental activities as Green Partners, we certified 32 suppliers in fiscal year 2026.
- From among the certified Green Partners, we select and recognize as Environmental Partners those suppliers that demonstrate outstanding environmental initiatives and have made significant contributions to the development of environmental technology.
- We quantify the environmental activities of each supplier and conduct environmental performance reviews.
Sharing Information with Suppliers
We offer information we gather about the environment and share the activity details based on that information with all our suppliers.
We believe that achieving net zero by fiscal year 2041 will also depend on cooperation in reducing emissions by our customers’ and suppliers’ production lines, in addition to reductions in CO₂ emissions within the Group.
We have begun engaging in discussions with some of our suppliers and fleshing out measures to achieve these goals. We are also assigning persons in charge of net zero initiatives at each of our manufacturing sites and developing our internal systems. Going forward, we will work proactively to preserve the global environment across the entire supply chain through our partnerships with customers and suppliers.
Environmental Risks and Opportunities
Various environmental issues affect our daily lives and corporate activities. Physical risks, such as rising average global temperatures, strong winds, disasters and water shortages caused by climate change and abnormal weather, are expected to damage assets, increase operating costs and impact the supply chain. In addition, legal risks including stronger environmental laws and regulations, more stringent regulations on greenhouse gas emissions and the introduction of carbon taxes are expected to lead to higher costs for associated measures.
At the same time, promoting environmental initiatives leads to more opportunities to sell environmentally friendly products and reduce operating costs. We also recognize that providing high-value-added products that contribute to higher performance and lower power consumption of semiconductors leads to the building of an energy-saving society that makes the most of information technology, and thus provides an opportunity to improve corporate value.
Based on the requirements of ISO 14001, we identified and analyzed internal and external issues in relation to the environment, namely, our relationship with the climate, air quality and water quality. We also clarified the environmental needs and expectations of customers, suppliers, governments and employees and identified our compliance obligations as an organization. In addition, we define risks and opportunities to address as: (1) environmental management by reducing the environmental impact of our business activities, (2) compliance with applicable laws and (3) enhancing product competitiveness with the environmental contribution of products.
In addition, we are also considering risks and opportunities that are expected to occur due to the impact of climate change based on recommendations of the TCFD.
TCFD
Initiatives Related to Recommendations of the Task Force on Climate-related Financial Disclosures (TCFD)
Based on the TCFD recommendations, we examine the risks and opportunities that climate change poses to our business and take various response measures as we work to disclose information on an ongoing basis. In addition, since fiscal year 2024 we have referred to the disclosure standards of IFRS S2*.
IFRS S2: International Financial Reporting Standards (IFRS) Sustainability Standards of Disclosure S2 Climate-related disclosures
Status of Initiatives Related to Recommendations of the TCFD
| Items | Contents | |
|---|---|---|
|
Governance
|
|
|
| Strategy |
|
|
| Risk Management |
|
|
| Metrics and Targets |
|
|
Refer to Risk Management
Refer to E-COMPASS, Initiatives with Suppliers (E-COMPASS)
Refer to Environmental Goals and State of Progress
Anticipated Risks and Opportunities of Climate Change Impact and Our Response
We conducted a climate change scenario analysis in accordance with the TCFD recommendations.
We refer to the 1.5°C scenario*¹for risks related to the transition to a low-carbon economy and the 4°C scenario*² for risks related to the physical impacts of climate change. We assessed the impact of anticipated risks and opportunities over the short-, medium-, and long-term, and clarified our response.
- Timeline: Short-term = five years or less; medium-term = 2030; long-term = 2050
-
Scenarios used: 1.5°C scenario (1.5°C temperature increase): IEA (International Energy Agency) Net Zero Emissions by 2050 Scenario, RCP2.6 (low stabilization scenario)
4°C scenario (4°C temperature increase): IEA Stated Policies Scenario (STEPS), RCP8.5 (high reference scenario)
In addition to the above, we also refer to RCP4.5 (medium stabilization scenario) and RCP6.0 (high stabilization scenario) - Scope: The entire Group as well as the entire value chain including upstream and downstream
- Details deliberated: Current and emerging regulatory risks, technology risks, legal risks, litigation risks, market risks, reputational risks, and both acute and chronic physical risks related to existing and new businesses
1.5˚C scenario: Scenario to limit the temperature increase from pre-industrial times to1.5°C
4˚C scenario: Scenario with no additional easing measures against climate change
| Type (Scenario) | Risk or Opportunity Items | Timeline of Manifestation | Anticipated Risks or Opportunities | Impact on Tokyo Electron | Impact Evaluation*¹ | Our Response |
|---|---|---|---|---|---|---|
| Transition Risks (1.5°C scenario) |
|
Short- to medium-term |
|
|
Low |
|
|
Short- to long-term |
|
|
Low~ High |
|
|
| Physical Risks (4°C scenario) |
|
Short- to medium-term |
|
|
High |
|
|
Medium- to long-term |
|
|
Low |
|
|
| Opportunities (Common) |
|
Short- to medium-term |
|
|
High |
|
|
Medium- to long-term |
|
|
Middle~ High |
||
|
|
|||||
|
|
|||||
|
|
Impact evaluation: Sets out the findings of evaluations of the impact of risks or opportunities within Tokyo Electron.
Carbon tax: We referred to the International Energy Agency (IEA) Net Zero Emissions by 2050 Scenario for the increase in tax associated with GHG emissions. 1 U.S. dollar was converted as 155 yen.
SEMI: A global industry association representing the electronics manufacturing and design supply chain
Suppliers’ BCP assessments: Surveys have been conducted since fiscal year 2014 for suppliers accounting for more than 80% of our procurement spend (more than 85% of our procurement spend from fiscal year 2023).
MAGIC: Positioning the diversifying semiconductor market as MAGIC (Metaverse, Autonomous Mobility, Green Energy, IoT & Information, Communications) and proposing solutions based on leading-edge technology and experience based on an extensive installation record
Advocacy: Social activities and awareness-raising efforts aimed at influencing decisions in politics, economics, and society
SEMI Semiconductor Climate Consortium: A consortium of semiconductor value chain companies established to accelerate greenhouse gas emission reductions from the semiconductor ecosystem
CO₂ Emissions Across the Value Chain
We aim to resolve environmental problems through leading technology and reliable services, understand the environmental impact generated throughout our entire value chain and promote business activities to reduce that impact.
Our total Scope 1 and Scope 2 CO₂ emissions is 63 kilotons, while Scope 3 as the sum of upstream and downstream activities accounts for a total of 14,203 kilotons, 99.6% of the total. Of this, CO₂ emissions when using products stand at 8,080 kilotons, about 60% of the total. This is why we consider the development of products with low CO₂ emissions during operation to be important.
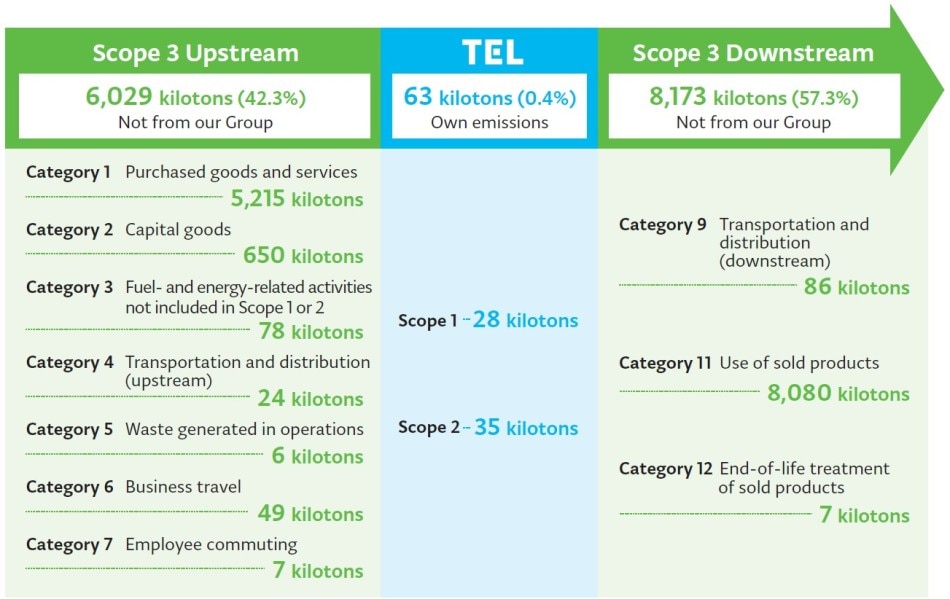
- Scope 1: Direct greenhouse gas (GHG) emissions from use of fuel and gas we owned or controlled
- Scope 2: Indirect GHG emissions from use of electricity, steam, and heat we purchased
- Scope 3: Emissions from corporate value chains (excluding Scope 1 and 2 emissions), such as product transportation, employee business travel, and major outsourced production processes. Scope 3 is divided into upstream activities, which include emissions associated with purchased or procured products and services, and downstream activities, which include emissions associated with sold products and services
Environmental Goals and Progress
We have obtained SBT*¹ certification for both our medium-term environmental targets and our net zero target, and we are working to meet these science-based targets while reducing greenhouse gas emissions across the supply chain. Climate action is recognized internationally as a pressing issue. Guided by these targets, we are carrying out a range of measures to help protect the global environment and to lead the drive to net zero as a company of global excellence.
In October 2023, we received SBT certification from the Science Based Targets initiative (SBTi)*², recognizing that the greenhouse gas reduction targets we had set for fiscal year 2031 were scientifically based. Furthermore, net zero targets to reduce greenhouse gas emissions across the whole value chain, including Scope 1*³, 2*⁴ and 3*⁵ set for fiscal year 2041, also received SBT certification in January 2025.
For Scope 1 and 2, the guidance recommends selecting the most recent past year for which data is reliable and complete as a base year. We have therefore adopted fiscal year 2019 as the base year, because emissions data covering our sites in Japan and overseas was in place for that year, the year reflects normal business activity, and the data is reliable in that it is unlikely to contain anomalies caused by COVID-19. For Scope 2, we use market-based method. For Scope 3, the base year is fiscal year 2022, the most recent year available when the targets were set.
SBT: Science Based Targets. SBTs are targets that companies set for 5 to 15 years in the future and that match the standards required by the Paris Agreement.
SBTi: An international initiative that assesses and validates corporate GHG emission reduction targets.
Scope 1: Direct GHG emissions from using fuels and gases owned or controlled by the company.
Scope 2: Indirect GHG emissions from the use of purchased electricity, steam, and heat.
Scope 3: Emissions from corporate value chains (excluding scope 1 and 2 emissions), such as product transportation, employee business travel, and major outsourced production processes. Scope 3 is divided into upstream activities, which including emissions associated with purchased or sourced products and services, and downstream activities, which include those associated with sold products and services.
| Targets recognized as SBTs | |||||
|---|---|---|---|---|---|
| Target year | Scope | Target | FY 2026 Progress | ||
| FY2031 | Scope 1,2 | CO₂ emissions | 70% reduction (compared to fiscal year 2019) |
64% reduction | |
| Renewable energy (electricity) |
Use rate | 100% | 87% | ||
| Scope 3 | Per-wafer CO2 emissions* | 55% reduction (compared to fiscal year 2022) |
11% reduction | ||
| FY2041 | Scope 1,2,3 | CO₂ emissions | Net zero (effectively zero) |
Established a group-wide structure and implemented measures for reduction | |
Including reductions resulting from customers’ introduction of renewable energy
Initiatives Concerning Own Emissions (Scope 1 and 2)
We aim to reduce total CO₂ emissions from plants and offices by 85% (compared to fiscal year 2019 levels) and use renewable energy for 100% of our power by fiscal year 2031. By fiscal year 2041, we plan to achieve net zero.
The ratio of renewable energy used in all companies in fiscal year 2026 was 87% because electricity consumption rose as we installed development equipment at overseas sites. In fiscal year 2026, we installed solar power generation for on-site consumption at Tokyo Electron Korea and Tokyo Electron Kunshan, as part of energy-saving activities across the Group, and reduced total CO₂ emissions from our plants and offices by 63%. Going forward, we will continue to accelerate the adoption of renewable electricity at our overseas sites and further strengthen our initiatives to reduce CO₂ emissions.
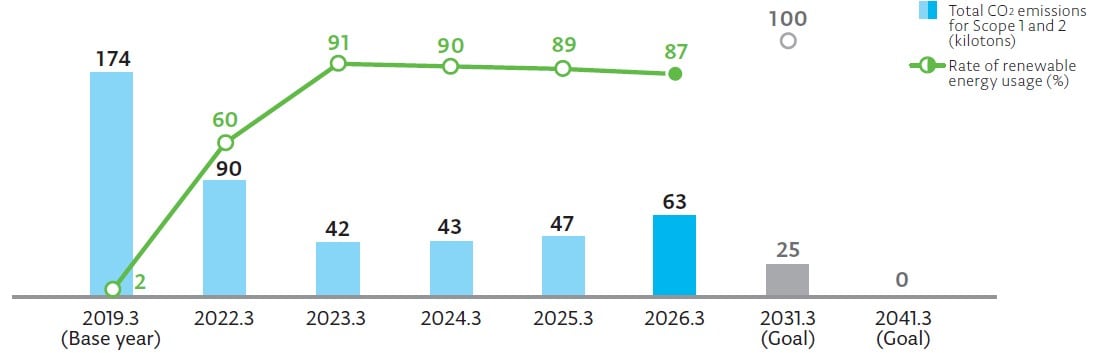
CO₂ Emissions Reductions from the Introduction of Renewable Energy, etc.
Initiatives Concerning Emissions Not from Our Group (Scope 3) (Category 1)
To reduce CO₂ emissions from purchased goods and services, we are acquiring actual data from suppliers. By holding briefing sessions and individual meetings, we are promoting efforts to enable all suppliers to calculate their Scope 3 (Category 1) emissions by March 2028.
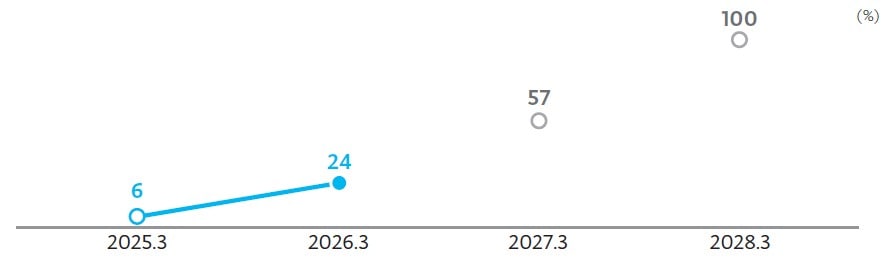
Ratio of Suppliers for which Scope 3 (Category 1) Emissions Have Been Calculated
Initiatives Concerning Emissions Not from Our Group (Scope 3) (Category 11)
To reduce the greenhouse gases emitted when customers use our products (Scope 3, Category 11), we have set a target of cutting CO₂ emissions per wafer, including reductions resulting from customers’ introduction of renewable energy, by 55% from fiscal year 2022 levels by fiscal year 2031. We also aim to achieve net zero by fiscal year 2041. In fiscal year 2026, CO₂ emissions per wafer were 11% below the base period. Emissions per wafer rose in relative terms as products with higher CO₂ emissions took up a larger share of our portfolio, and we will now accelerate the rollout of products that emit less CO₂.
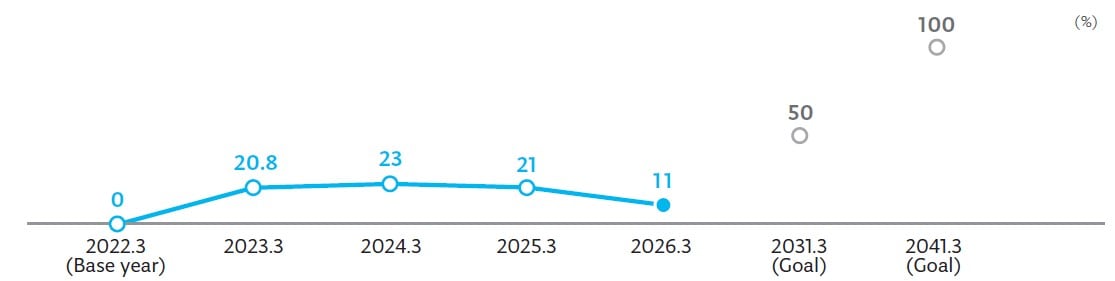
Reduction Rates in CO₂ Emissions Related to Products
Achievement levels of goals
〇Proceeding well △Need to accelerate to achieve the goal
| Item | Scope | Target | Target FY | FY 2026 Results | Evaluation |
|---|---|---|---|---|---|
| Plants and offices |
Total CO₂ emissions | 85% reduction (compared with fiscal year 2019) |
FY2031 | 64% reduction | △ |
| Renewable energy (electricity) | 100% | FY2031 | 87% | 〇 | |
| Energy consumption (per intensity) | 1% year-on-year reduction | Maintain each year | Achieved at 2 of 11 plants and offices | △ | |
| Water consumption (per intensity) | Maintain base year level | Maintain each year | Achieved 6 of 13 targets | △ | |
| Waste recycling rate | 97% or above | Maintain each year | 98.5% | 〇 | |
| Products | CO₂ emissions per wafer (including reductions resulting from customers’ introduction of renewable energy) |
55% reduction (compared with fiscal year 2022) |
FY2031 | 11% reduction | △ |
| Logistics | CO₂ emissions | 30% reduction | FY2027 | 26% reduction | 〇 |
| Ratio of wooden packaging materials used for products (packaging of semiconductor production equipment) | Reduce to 40% or less | FY2027 | 52% | 〇 | |
| Nature | Biodiversity activities | Hold at least two ecosystem tours or similar at each site in Japan | Maintain each year | 24 events held 408 participants |
〇 |
Based on the roadmap for products to achieve the goals, for each product we calculated the reduction in consumption of electricity, process gases and chemicals, water, and other resources depending on how much of the above are consumed when the relevant product is manufactured or used, effects of the reduction in consumption of these resources, and the reduction in consumption due to improved productivity. We will continue to work as one company on initiatives aimed at achieving net zero by fiscal year 2041.
Progress in related initiative
- Reduction of water consumption: Initiatives to Conserve Water Resources and Reduce Water Consumption
- Reduction of waste: Initiatives to Reduce Waste
- Management of toxic substance emissions: Management of Chemical Substances, Initiatives for Product Environmental Laws and Regulations
Initiatives for Product Development
We are actively developing products with reduced environmental impact, and we develop advanced environmental technologies through the E-COMPASS program.
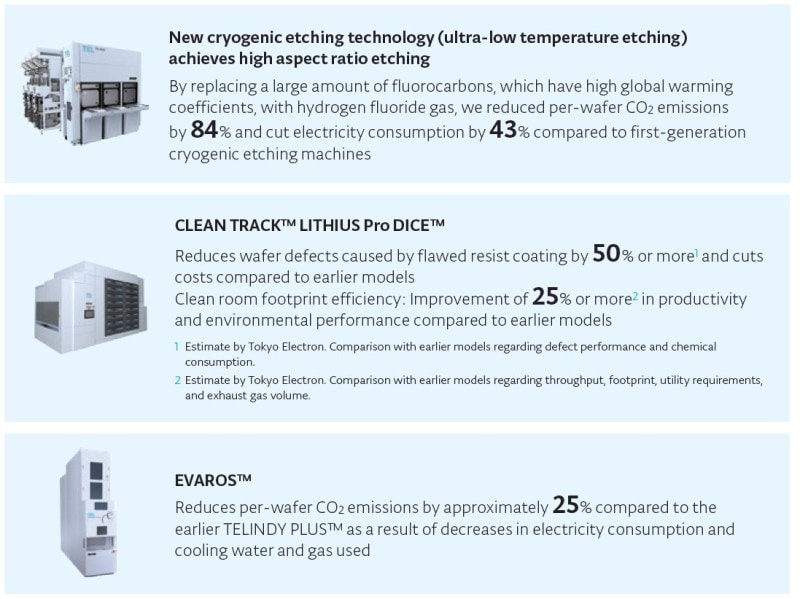
Example Initiative 1
We use the Green Transformation (GX) Monitor, which captures information on energy use including electricity, water and nitrogen, as well as equipment operating status, and turns it into a database, to visualize energy consumption information during product use. Specifically, we have introduced a system that allows us to check equipment operating status and energy consumption information in chronological order through our intranet, and are planning to expand the scope of this system going forward.
We will continue to work to further raise environmental awareness and incorporate environmental technologies as important added value in our technological strategies, thus contributing to the reduction of the environmental impact of society as a whole.
Example Initiative 2
To reduce the amount of ultra-pure water used and achieve stable operations through recirculation, we created a system that recovers 95% of ultra-pure water* used in cleaning processes, which in the past was discharged from pipes while equipment was in standby, and recirculates it for reuse.
Ultra-pure water is high-purity water suitable for cleaning that has contaminants reduced to extremely low levels.
Initiatives for Product Environmental Laws and Regulations
To keep pace with environmental regulations that are becoming more varied and more demanding worldwide, we gather information on the environmental laws and regulations that apply to our products and respond proactively. Substances regulated in individual countries, along with those expected to become subject to regulation, are compiled in the TEL Substances List, which we revise regularly. This strengthens our management from product design through procurement and manufacturing and supports our work to eliminate these substances or replace them with alternatives. Using the chemSHERPA*¹ format we adopted in fiscal year 2021, we also collect information from suppliers on chemical substances contained in their products at concentrations measured in parts per billion (ppb). In response to the EU REACH Regulation*², we compile information on substances of very high concern (SVHCs) and communicate it appropriately. We have also confirmed that other regulated hazardous chemical substances are not present in our products.
In response to GHS*³ requirements, we provide the safety data sheets (SDS*⁴) and labels needed when supplying chemical products to customers, and we promote the local procurement of chemical products.
For PFAS*⁵, we survey whether the substances are contained and promote to replace them with alternatives. We also work through industry associations to feed on-the-ground expertise into policy and to encourage regulators to apply the rules in a practical and even-handed way. This work supports the healthy development of the semiconductor industry and the safety of society at large.
To comply with the frequently revised environmental laws and regulations, we continue to offer Product Environmental Compliance training to all employees, and provide suppliers with information related to the relevant environmental laws and regulations.
We will continue to grasp each country’s environmental laws and regulations rapidly and strive to respond appropriately.
chemSHERPA: A data entry support tool for appropriately communicating information on chemical substances in products across the entire supply chain, and a common system for communicating information on chemical substances contained in products
EU REACH Regulation: Registration, Evaluation, Authorisation and Restriction of Chemicals. Comprehensive European Union legislation on the manufacture, import, and distribution of chemical substances, enacted to protect human health and the environment
GHS: Globally Harmonized System of Classification and Labelling of Chemicals
SDS: Safety Data Sheet. Refers to the document containing hazard information about chemical substances that is issued when a company transfers or provides chemical substances, or products containing chemical substances, to another company
PFAS: A collective term for perfluoroalkyl and polyfluoroalkyl compounds
New York State 6 NYCRR* Part 494
We comply with New York State 6 NYCRR Part 494 - Hydrofluorocarbon Standards and Reporting.
For more information or to request a copy of the disclosure documents pursuant to NY Part 494, please contact: product.compliance@us.tel.com.
NYCRR: New York Codes, Rules and Regulations
Product Reuse and Recycling
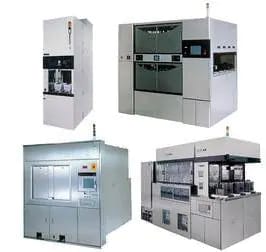
Semiconductors are in greater demand and are becoming more diverse than ever. This has driven a corresponding rise in the need for more varied semiconductor production equipment. As a leading manufacturer of semiconductor equipment, we are strongly encouraging reuse and recycling of equipment and components by marketing refurbished our equipment and offering modification services to customers who already have our equipment installed.
Our refurbished equipment operations start with procuring used equipment from the market, which takes place either directly or through leasing companies. This equipment is then properly tested and refurbished, before being offered to customers as our Certified Used Equipment. Our equipment modification services boost the productivity of installed equipment by maintaining and improving its quality and availability. Through these approaches, we address our customers’ cost, speed, and performance needs, while also contributing to waste reduction and resource conservation and utilization. These efforts help reduce the use of resources and CO₂ emissions associated with procuring and manufacturing equipment and components. They are also effective in reducing the costs of production, logistics, and waste disposal.
Parts Recycling
We leverage the technology cultivated over many years in the aftermarket business (maintenance, repair, etc.) to recycle large numbers of parts. As of September 2026, the reuse rate* for high-frequency RF systems among three major customers was 87%.
The reuse rate is calculated as the number of specified parts reused divided by (the number of reused parts plus the number of newly purchased parts).
Plant and Office Initiatives
Introducing Renewable Energy
We have set medium-term environmental goals of total CO₂ emissions at plants and offices by 85% (compared with fiscal year 2019) and rate of 100% renewable energy (electricity) usage at plants and offices by fiscal year 2031. For fiscal year 2026, the ratio of renewable energy used in all companies reached 87%, achieving a 63% reduction in CO₂ emissions compared to the base year.
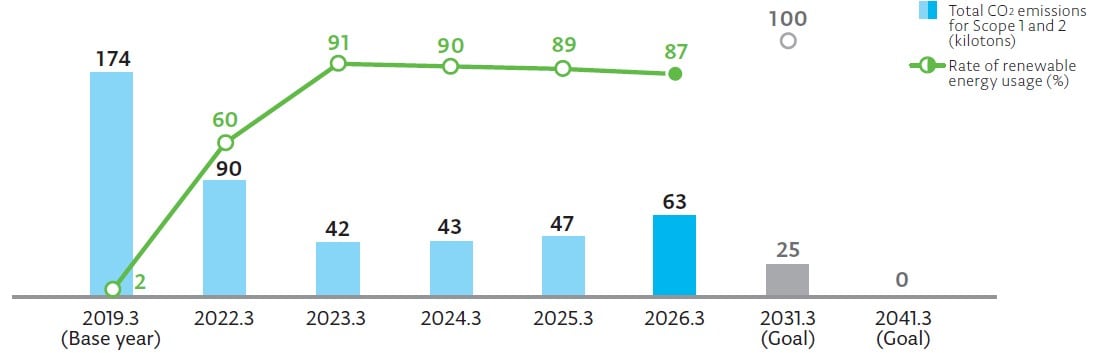
CO₂ Emissions Reductions from the Introduction of Renewable Energy, etc.
All manufacturing sites, plants, and offices in Japan began introducing renewable energy in fiscal year 2023. Starting in fiscal year 2024, we expanded these initiatives to the U.S., and as a result, the transition to renewable energy has been completed at our sites in Japan, the U.S., and China. Going forward, we plan to further promote the adoption of renewable energy at our other overseas offices.
Example initiative
At Tokyo Electron Miyagi (Taiwa), monitors displaying the energy profile of renewable energy generated from solar panels have been set up at the entrance to the plant. At Tokyo Electron Kyushu (Koshi), renewable energy generation initiatives are being promoted, such as the sale of generated energy. Following the Tainan Operation Center at Tokyo Electron Taiwan, which came online in fiscal year 2025, we also installed solar power generation at the Pyeongtaek Office of Tokyo Electron Korea and at Tokyo Electron Kunshan. As a result, renewable energy generation across the Group globally totaled 4,047 MWh in fiscal year 2026, 6% more than in fiscal year 2025.
Initiatives to Prevent Global Warming and Save Energy
We have brought in a number of initiatives to achieve our environmental goals at plants and offices, including energy-saving cleanroom operation, setting office air-conditioning at appropriate temperatures, introducing devices that offer superior energy-saving performance and bringing in renewable energy.
Specifically, we are analyzing hourly and seasonal energy usage trends, usage efficiency, and more, and we are identifying buildings, equipment, and processes with especially high energy usage levels. We are also deliberating and implementing measures for cutting energy usage and for using energy more efficiently. Regarding the investments made in fiscal year 2025 to reduce CO₂ emissions, the cost is estimated to be approximately 14,000 yen per ton. It is assumed that the effects of these investments will continue for 10 years. We will use these figures as a reference for the shadow price in our internal carbon pricing.
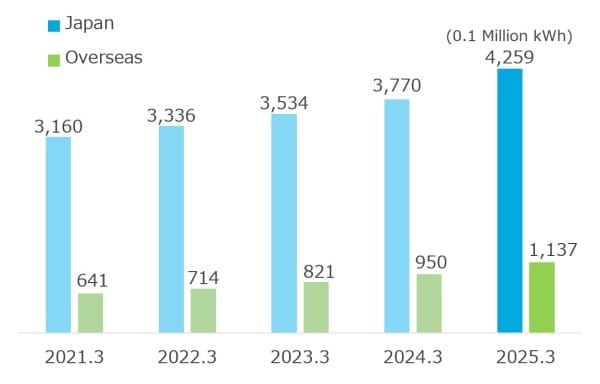
While we continued to use renewable energy (electricity) in Japan, the U.S. and China in fiscal year 2026, power consumption rose at sites that have not adopted renewable energy, and Scope 1 and 2 emissions came to 63 kilotons, a 34% increase year on year. Electricity consumption reached 5,400 (100,000 kWh), a 14% increase year on year, because of the launch of operations in a new building and an increase in the energy used for product development evaluation.
From fiscal year 2019, we revised and standardized the per-unit basis* for plants and offices in Japan to more appropriate levels based on the correlation between business operations and energy. In fiscal year 2026, we met our annual sustainability target for energy consumption per unit at two of our 11 plants and offices in Japan and overseas.
The per-unit basis is calculated by compound weighting using data on the number of development and evaluation machines, production volume, floor space, and man-hours in each region.
Energy Consumption and Energy Consumption per Net Sales
Example initiative 1
The introduction of a system to visualize clearly how much energy is saved at our plants and offices was completed at our major manufacturing sites in Japan in fiscal year 2022. Previously, energy consumption data had to be manually extracted and changes graphed by hand, but integrated management on the cloud has made it possible to check changes at any time. This has made it easier to check the deployment and effects of BKM* at each plant as well as study or implement measures.
More concretely, while in the past we were able to monitor increases and decreases in power consumption for entire business sites and buildings, now we are able to check increases and decreases for each piece of equipment such as refrigeration units, compressors, and lighting, making it easier to analyze and clarify the causes of increases and decreases in usage. In addition, this visualization system has made it possible to compare the effects of capital investment for energy conservation with pre-investment data for a more accurate understanding of the effects. We will accelerate our energy-conservation activities related to operations.
BKM: Best Known Method
Example initiative 2
Tokyo Electron BP holds Energy Conservation Competitions in which employees at each site are encouraged to offer ideas for achieving "net zero" (both Scope 1, 2 and 3 emissions and water resource usage) that are feasible within three years. Excellent proposals are announced, reviewed and publicly recognized. In fiscal year 2026, the seventh competition was held and "Compressor consolidation" presented by Tokyo Electron Technology Solutions (Fujii) won the top prize. If this proposal is implemented, it is expected to reduce approximately 939 tons of CO₂ annually. These Energy Conservation Competitions provide us with new ideas about how to conserve energy and resources, and we will continue these activities in the future.
Initiatives to Conserve Water Resources and Reduce Water Consumption
With the growing importance of water resource preservation, we use WRI Aqueduct*¹ and freshwater resource quantity indicators to conduct water risk assessments in Japan and overseas*². In addition, we confirm the status of water resource use in the supply chain, rainwater and wastewater management and goal setting with suppliers once a year. In recognition of this work, we were named to the A List, the highest rating, in the water security assessment conducted by the non-governmental organization CDP*³ in fiscal year 2026.
We have established an annual sustainability goal of maintaining the same water consumption level of the base year (fiscal year defined by each Japan and overseas site). To achieve these goals, we analyze hourly and seasonal water usage trends, water usage efficiency and the like. We identify buildings, processes and equipment with particularly high water usage rates and consider and implement measures for reducing water usage and improving energy usage efficiency. Specifically, we are carrying out initiatives for cutting water usage such as reusing pure water from our manufacturing operations, installing water-saving devices for domestic water, watering lawns with rainwater, implementing the intermittent operation of cafeteria faucets and reusing runoff in combustion-based exhaust abatement systems. We are also performing regular water quality studies to prevent any impact on our development or production processes. Water discharge is treated using water treatment facilities and then is confirmed to fall below legal and regulatory limits before being discharged.
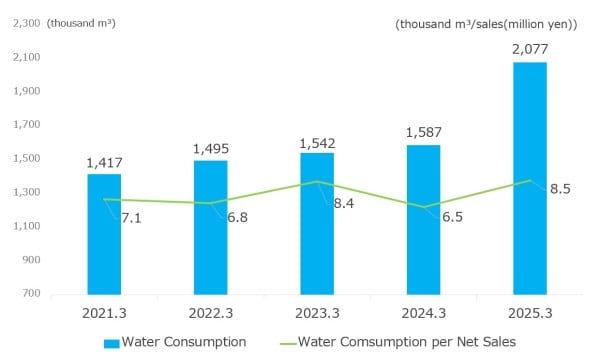
In fiscal year 2026, due to an increase in usage resulting from launching operations in a new building, the amount of water consumption increased by 31% year on year to 2,077,000 m³. Water consumption per net sales also increased 31% year on year. Of the targets set at our plants and offices in Japan and overseas, we achieved six of 13.
WRI Aqueduct: A water risk assessment tool developed by the World Resources Institute
Refer to Taskforce on Nature-related Financial Disclosures(TNFD)
CDP: A non-governmental organization (NGO) established in the U.K. that surveys private companies and local governments on climate change and water resource management and publishes the results
Water Consumption and Water Consumption per Net Sales
Example initiative
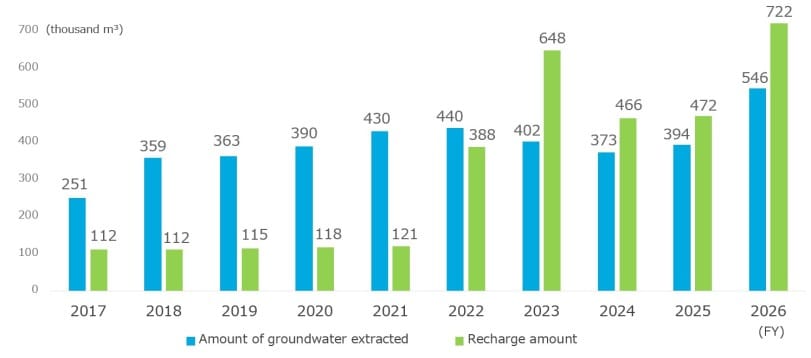
Tokyo Electron Kyushu (Koshi) uses groundwater, and to keep extraction and recharge in balance it adopted a policy in fiscal year 2022 of recharging* at least as much groundwater as it extracts (100% or more). To that end, it floods fallow rice fields in winter, takes part in rice-growing activities, and purchases rice grown on recharge paddies (water offsetting).
As a result, the volume recharged has exceeded the volume extracted every year since fiscal year 2023. We will continue these groundwater conservation activities to protect the valuable water resources of Kumamoto.
The process of water soaking into the ground and storing as groundwater
Initiatives to Reduce Waste
To reduce waste, we are striving to curb the amount of waste we generate and to recycle waste. In addition to using an electronic manifest system*¹ to properly manage waste, we are confirming statistical data regarding waste and on-site verification of equipment to assess waste production trends and their causes. We are identifying buildings, processes, and equipment that generate particularly large amounts of waste and implementing measures to reduce the waste they generate. These measures include separating waste and adding new processes. Specifically, to raise recycling rates and cut the amount of waste, we are thoroughly separating waste, thoroughly preventing the wasting of resources, rationalizing parts inventories, using reusable boxes for deliveries, reusing cushioning material, and contracting with waste operators capable of performing recycling. Through these efforts we are reducing the amount of waste that is sent to landfills or incinerated without recovering energy. We are also renovating our waste storage sites to increase their capacity while reducing the frequency of collection. Through this, we are striving to not only cut waste processing costs but also to reduce environmental impact.
Through these efforts, in fiscal year 2026 we produced 382 tons of waste to be incinerated without recovering energy or buried in a landfill and achieved a recycling rate*2 of 98.5% across the Group worldwide. This marked the 20th consecutive year, since fiscal year 2007 that we have achieved our target recycling rate of 97% or above. We also maintained a high recycling rate of 93.1% at our overseas sites.
Electronic manifest system: A system in which, instead of using printed manifests to manage industrial waste, the flow of industrial waste products is managed through a communications network that connects information processing centers, waste generating enterprises, waste collection enterprises and waste disposal enterprises
Recycling rate: (Recycled amount/Amount of waste generated) × 100
Example initiative
At Tokyo Electron Kyushu, pallets that are partly made from ocean-bound plastics (recycled plastics known as OBPs) are used to store products in stock. Environmental issues related to plastic waste have been drawing attention in recent years. In particular, marine plastic waste is posing serious problems. OBPs, which are plastic waste disposed of in land areas within 50 km from the sea may, if left uncollected, flow into the sea as marine plastic waste and contaminate the environment. We use pallets made from OBP to help combat the problem of ocean pollution.
Management of Chemical Substances
We constantly monitor and manage our use and release of any chemical substances used in product development and manufacturing subject to the Japanese PRTR* law. Whenever we introduce a new chemical substance or change the way an existing substance is used, we check for environmental, health and safety risks beforehand and conduct appropriate processing after use such as by contracting expert vendors and using in-house processing facilities. In response to the Fluorocarbons Recovery and Destruction Law, we conduct simple checks, regular inspections and so on based on law in an effort to monitor the amounts of fluorocarbons filled and recovered.
PRTR: Pollutant Release and Transfer Register. A framework for tracking, tabulating and disclosing quantitative data on chemical substances that may be hazardous to human health and the ecosystem, including the amounts used and discharged into the environment and the amounts transferred (as part of waste) from the plants and offices
Biodiversity and Forest Conservation (TNFD)
Our business activities are made possible by biodiversity. We recognize that our business activities have some impact on biodiversity, so we work to protect this biodiversity. We set a goal of conducting ecosystem tours or conservation activities at our plants and offices in Japan at least twice a year. In fiscal year 2026, we held a total of 24 such events, with a total of 408 participants.
In fiscal year 2023, we formulated commitments to biodiversity and forest conservation with the approval of the CEO.
These commitments applied to our entire value chain, and at the 3rd TEL E-COMPASS Day, an event held in March 2024 for all of our suppliers, we shared the contents of these commitments and the measures we were conducting in relation to them.

Biodiversity and Forest Conservation Commitments
The benefits of biodiversity are essential for the sustainable development of society. However, human society’s activities are having a major impact on biodiversity.
Through “TEL’s Shared Value,” we are working to resolve social issues through business activities that make use of our expertise. We aim to realize “Net Positive Impact (NPI*)” across our entire value chain through ongoing initiatives to preserve biodiversity. We believe that promoting activities in partnership with our stakeholders will help to boost our corporate value in an ongoing manner. As part of these efforts, we aim to achieve zero deforestation through working proactively to protect forests, which are home to ecosystems comprising numerous organisms and which constitute important CO₂ sinks.
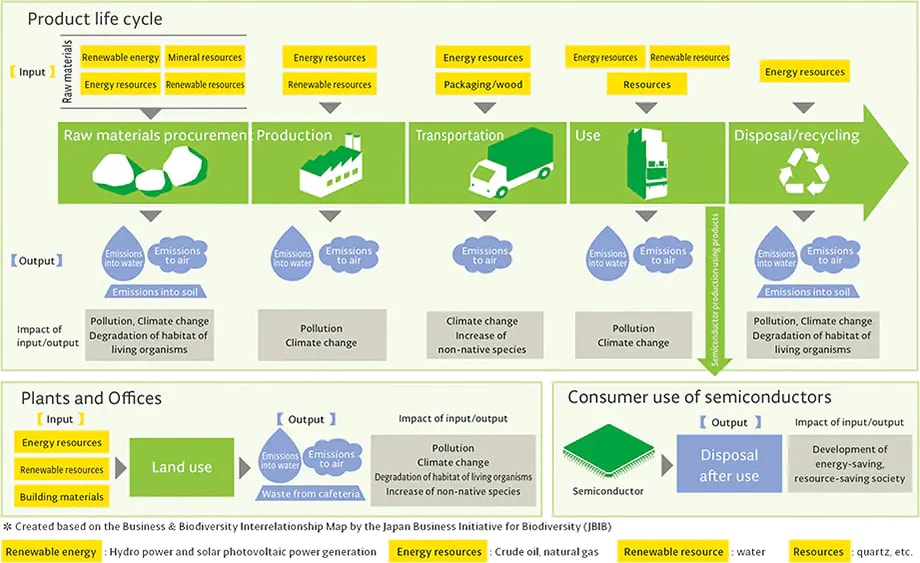
We make a map of biodiversity relationships based on the product life cycle assessments. We promote biodiversity initiatives based on the activity guidelines and the relationship map.
NPI: When loss of the natural environment cannot be avoided and the decision is instead taken to generate gains for the natural environment to offset the losses, ensuring that losses and gains are balanced constitutes “No Net Loss (NNL),” while going beyond this by ensuring that the gains outweigh the losses constitutes “Net Positive Impact (NPI).”
Interrelationship Map of Biodiversity Activities
Taskforce on Nature-related Financial Disclosures(TNFD)
Join the Taskforce on Nature-related Financial Disclosures(TNFD) Forum
In July 2023, we announced that we concur with the vision of the Taskforce on Nature-related Financial Disclosures(TNFD)*¹ and has joined the TNFD Forum, a group of institutions that support the activities of the taskforce.
TNFD is an international initiative established in June 2021 to support the transition to a nature-positive*² world, aiming to develop a risk management and disclosure framework for businesses with stakes in natural capital and biodiversity. The TNFD Forum was established in September 2021 as the taskforce's support organization that provides expert insights and technical assistance to TNFD.
We are assessing the impact of our business activities on nature and the risks the loss of nature poses to our business. We are working to disclose this information in an appropriate manner. We will also collaborate with our stakeholders to enhance natural capital and biodiversity through our entire value chain.
The Taskforce on Nature-related Financial Disclosures (TNFD) was launched in June 2021 with founding members including the United Nations Environment Programme Finance Initiative (UNEP FI), the United Nations Development Programme (UNDP), the World Wide Fund for Nature (WWF), and a British non-profit organization Global Canopy. With the aim of shifting global financial flows away from nature-negative outcomes and toward restoring biodiversity, the taskforce is developing a framework that drives businesses, institutions, and organizations to disclose risks and opportunities impacting natural capital and biodiversity.
Being “nature positive” means putting nature on the path to recovery by stopping and reversing the loss of biodiversity.
TNFD-based reporting
Having confirmed dependencies and impacts on biodiversity of our company’s businesses in fiscal year 2013, we prepared action guidelines to start our biodiversity initiatives. In fiscal year 2023, we formulated the commitments on biodiversity and forest conservation with the approval of the CEO. In fiscal year 2024, we joined the Taskforce on Nature-related Financial Disclosures (TNFD) Forum to understand the basic overview of TNFD and the LEAP* approach that it recommends. Based on this understanding, we investigated the circumstances surrounding our supply chains and identified and compiled the latest information on priority locations . We also interviewed our suppliers to explore the current conditions and outlook concerning sustainability of raw materials. By obtaining information on measures against land use and pollution related to mineral mining, water consumed by manufacturing processes, and commodity production with risks , among others, we assessed the sustainability of raw materials as well as confirmed the current conditions for measures to be taken in the future to identify the traceability of the places of origin of raw materials and the environmental impacts of raw material procurement and to reduce these impacts. Furthermore, we assessed the following risks related to biodiversity.
Locate, Evaluate, Assess, and Prepare: Four steps of risk and opportunity assessment
Biodiversity risk assessment
Impacts and dependencies of our businesses on nature
We analyzed the impacts and dependencies of our supply chains on nature utilizing ENCORE (Exploring Natural Capital Opportunities, Risks and Exposure), provided by Global Canopy, a UK non-profit organization engaging in monitoring of corporate impacts and dependencies on nature, the UN Environment Programme Finance Initiative, and the UN Environment Programme World Conservation Monitoring Centre (UNEP-WCMC) . As a result, we identified that our upstream supply chains have large impacts and dependencies on nature.
|
Supply chain
Upstream
|
Our company |
Supply chain
Downstream
|
||
|---|---|---|---|---|
| Dependencies | Ground/surface water | High | Middle | Middle |
| Climate regulation | High | Low | Low | |
| Impacts | Water use | High | Low | High |
| GHG emissions | High | Low | Middle | |
| Pollutants (Air, water, and soil) | High | Middle | Middle | |
| Solid waste | High | Middle | Middle | |
| Noise/light pollution | High | Middle | Middle |
Risks
- Water risks
We analyzed risks related to water, such as flooding, droughts, and water stress, of each site in and out of Japan utilizing Aqueduct 4.0, provided by the not-for-profit World Resources Institute (WRI). As a result, it was found that our sites in China and the U.K. are located in areas with high water-related risks (Refer to Results of Analyses using Various Tools).
- Biodiversity risks
Concerning the potential impact of our business activities on biodiversity, we surveyed the numbers of IUCN Red List species*¹ and KBAs*² within an approximately 50 km radius from each site in and out of Japan utilizing Integrated Biodiversity Assessment Tool (IBAT), provided by UNEP-WCMC. As a result, we identified that large numbers of threatened species exist around our sites in Taiwan and Singapore.
Our risk analysis using the Biodiversity Risk Filter, provided by World Wildlife Fund (WWF), also revealed that our sites in China have high risks related to water quality, soil, and air quality (Refer to Results of Analyses using Various Tools).
IUCN Red List: List of threatened wildlife species prepared by International Union for Conservation of Nature (IUCN)
Key Biodiversity Area KBA: Key areas for biodiversity conservation
- Deforestation risks
We surveyed the extent of deforestation over the past two decades in the areas where our sites in and out of Japan are located using the Global Forest Watch, provided by WRI, to grasp the forest conservation status. Korea has seen progress in deforestation, compared to other areas, with an approximately 18% decrease in the forest area over the past two decades (Refer to Results of Analyses using Various Tools).
Results of Analyses using Various Tools
| Aqueduct*¹ | IBAT*² | Biodiversity Risk Filter*³ |
Global Forest Watch*⁴ |
||||
|---|---|---|---|---|---|---|---|
| Water Stress | Water Risk | Water Pollution | IUCN Red list species*⁵ | KBAs | Scape Physical Risk | Deforestation Rate | |
| Japan | Middle | Middle | Middle | 1,444 | 7 | Middle | 4% |
| Korea | Middle | Middle | Middle | 926 | 7 | Middle | 18% |
| Taiwan | Middle | Middle | Middle | 3,220 | 5 | Middle | No Data available |
| China | High | High | High | 1,250 | 2 | High | 2% |
| U.S. | Middle | Low | Low | 968 | 2 | Middle | 3% |
| Europe (UK) | High | Middle | Low | 1,000 | 7 | Middle | 3% |
| Singapore | Low | Middle | Low | 3,192 | 7 | Middle | 13% |
Aqueduct: An online data platform provided by the not-for-profit World Resources Institute (WRI) that consolidates a wide range of information on water risks.
IBAT (Integrated Biodiversity Assessment Tool): An online tool that enables rapid map-based screening and assessment of protected areas, key biodiversity areas, distributions of threatened species, and other information around a specified location.
Biodiversity Risk Filter: A free online assessment tool for companies and financial institutions developed by the World Wildlife Fund (WWF).
Global Forest Watch: An online platform launched by the World Resources Institute (WRI) in 2014 that uses satellite imagery and cloud computing to monitor changes in forest cover and deforestation around the world in near real time.
Averages for areas with multiple sites.
TNFD Risk Analysis
| Type | Risk | Timeline of Risk Manifestation | Anticipated Risks | Impact on Tokyo Electron | Risk Evaluation | Our Response |
|---|---|---|---|---|---|---|
| Water |
|
Medium- to long-term |
|
|
Middle |
|
|
Medium- to long-term |
|
|
Low | ||
| Minerals |
|
Medium- to long-term |
|
|
Low |
|
|
Short- to long-term |
|
|
Low | ||
| Timber |
|
Medium- to long-term |
|
|
Low |
|
| Land use |
|
Medium- to long-term |
|
|
Low |
|
| Pollution (water quality, soil, solid waste, etc.) |
|
Short- to long-term |
|
|
Low |
|
| Opportunities |
|
Short- to long-term |
|
|
High |
|
|
Short- to long-term |
|
|
Low |
|
CMRT: Conflict Minerals Reporting Template. Survey format for reporting conflict materials, provided by the Responsible Minerals Initiative (RMI), which has established international guidelines on conflict minerals.
3TG: Tantalum, tin, tungsten and gold
As steps toward considering our measures against the water risks identified and specifying our commitments to biodiversity and forest conservation, we are planning to set indicators and action policies, perform detailed surveys of and activities in the surrounding areas of our sites, and engage in management of environmental and social risks related to minerals.
Example initiative
In June 2025, 64 people, including employees of Tokyo Electron Miyagi and their families, took part in the first Miyagi Prefecture Blue Carbon* Project, working to restore the eelgrass beds in Matsushima Bay that were lost in the Great East Japan Earthquake. On the day, participants surveyed biodiversity on the tidal flats and collected marine plastic waste. The survey confirmed the presence of Grandidierella sanrikuensis, an endangered amphipod, and showed participants how important eelgrass beds are as a habitat for marine life. For the children taking part, it was a chance to experience nature firsthand and learn why protecting the marine environment matters.
Restoring eelgrass beds is expected to lock carbon away over the long term, as eelgrass and other coastal ecosystems take up CO₂ that is then stored in the seabed and elsewhere. We will continue efforts that support carbon neutrality through the restoration and conservation of marine ecosystems.
Blue Carbon: Carbon taken up by coastal and marine ecosystems through photosynthesis and subsequently stored in the seabed or the deep ocean
Environmental Communication
Our environmental policy requires that we respond appropriately to the expectations of society. We promote initiatives for the environment while engaging in ongoing communication with all of our stakeholders.
In addition, to better promote environmental communication internally, we provide an environmental program for new employees and mid-career recruits, plus a refresher program for existing employees.
In fiscal year 2026, approximately 13,700 employees in Japan participated in the refresher program for existing employees. This training relates to our efforts to cut energy usage, our renewable energy initiatives, our efforts to reduce water usage, and our initiatives for reducing waste and raising recycling rates, helping change employees' mentalities regarding these issues. In fiscal year 2026, as in fiscal year 2025, we ran an online educational program for suppliers to give them a greater understanding of our environmental policies and goals. Specifically, the training will cover topics such as Tokyo Electron's Environment Policy, our medium- and long-term environmental goals, the importance of environmental and climate change-related measures, abnormal weather and global warming and the methods used to calculate Scope 1, 2 and 3 CO₂ emissions from the supply chain.
Example initiative 1
At Esashi Plant in Iwate, employees participate in activities of "Oshu Megumi Net*”, a citizens' environmental conference in Oshu City. In fiscal year 2026, they promoted communication by participating in nature observation activities with local residents, such as a shiitake inoculation workshop and a session on getting to know vegetables by eating them.
The Oshu Environmental Citizens' Council, known as "Oshu Megumi Net," was established to preserve the beautiful environment of Oshu City, and to pass on the spirit of environmental protection to future generations. Currently, approximately 100 individuals, companies, and organizations have joined and are actively engaged in its activities.
Example initiative 2
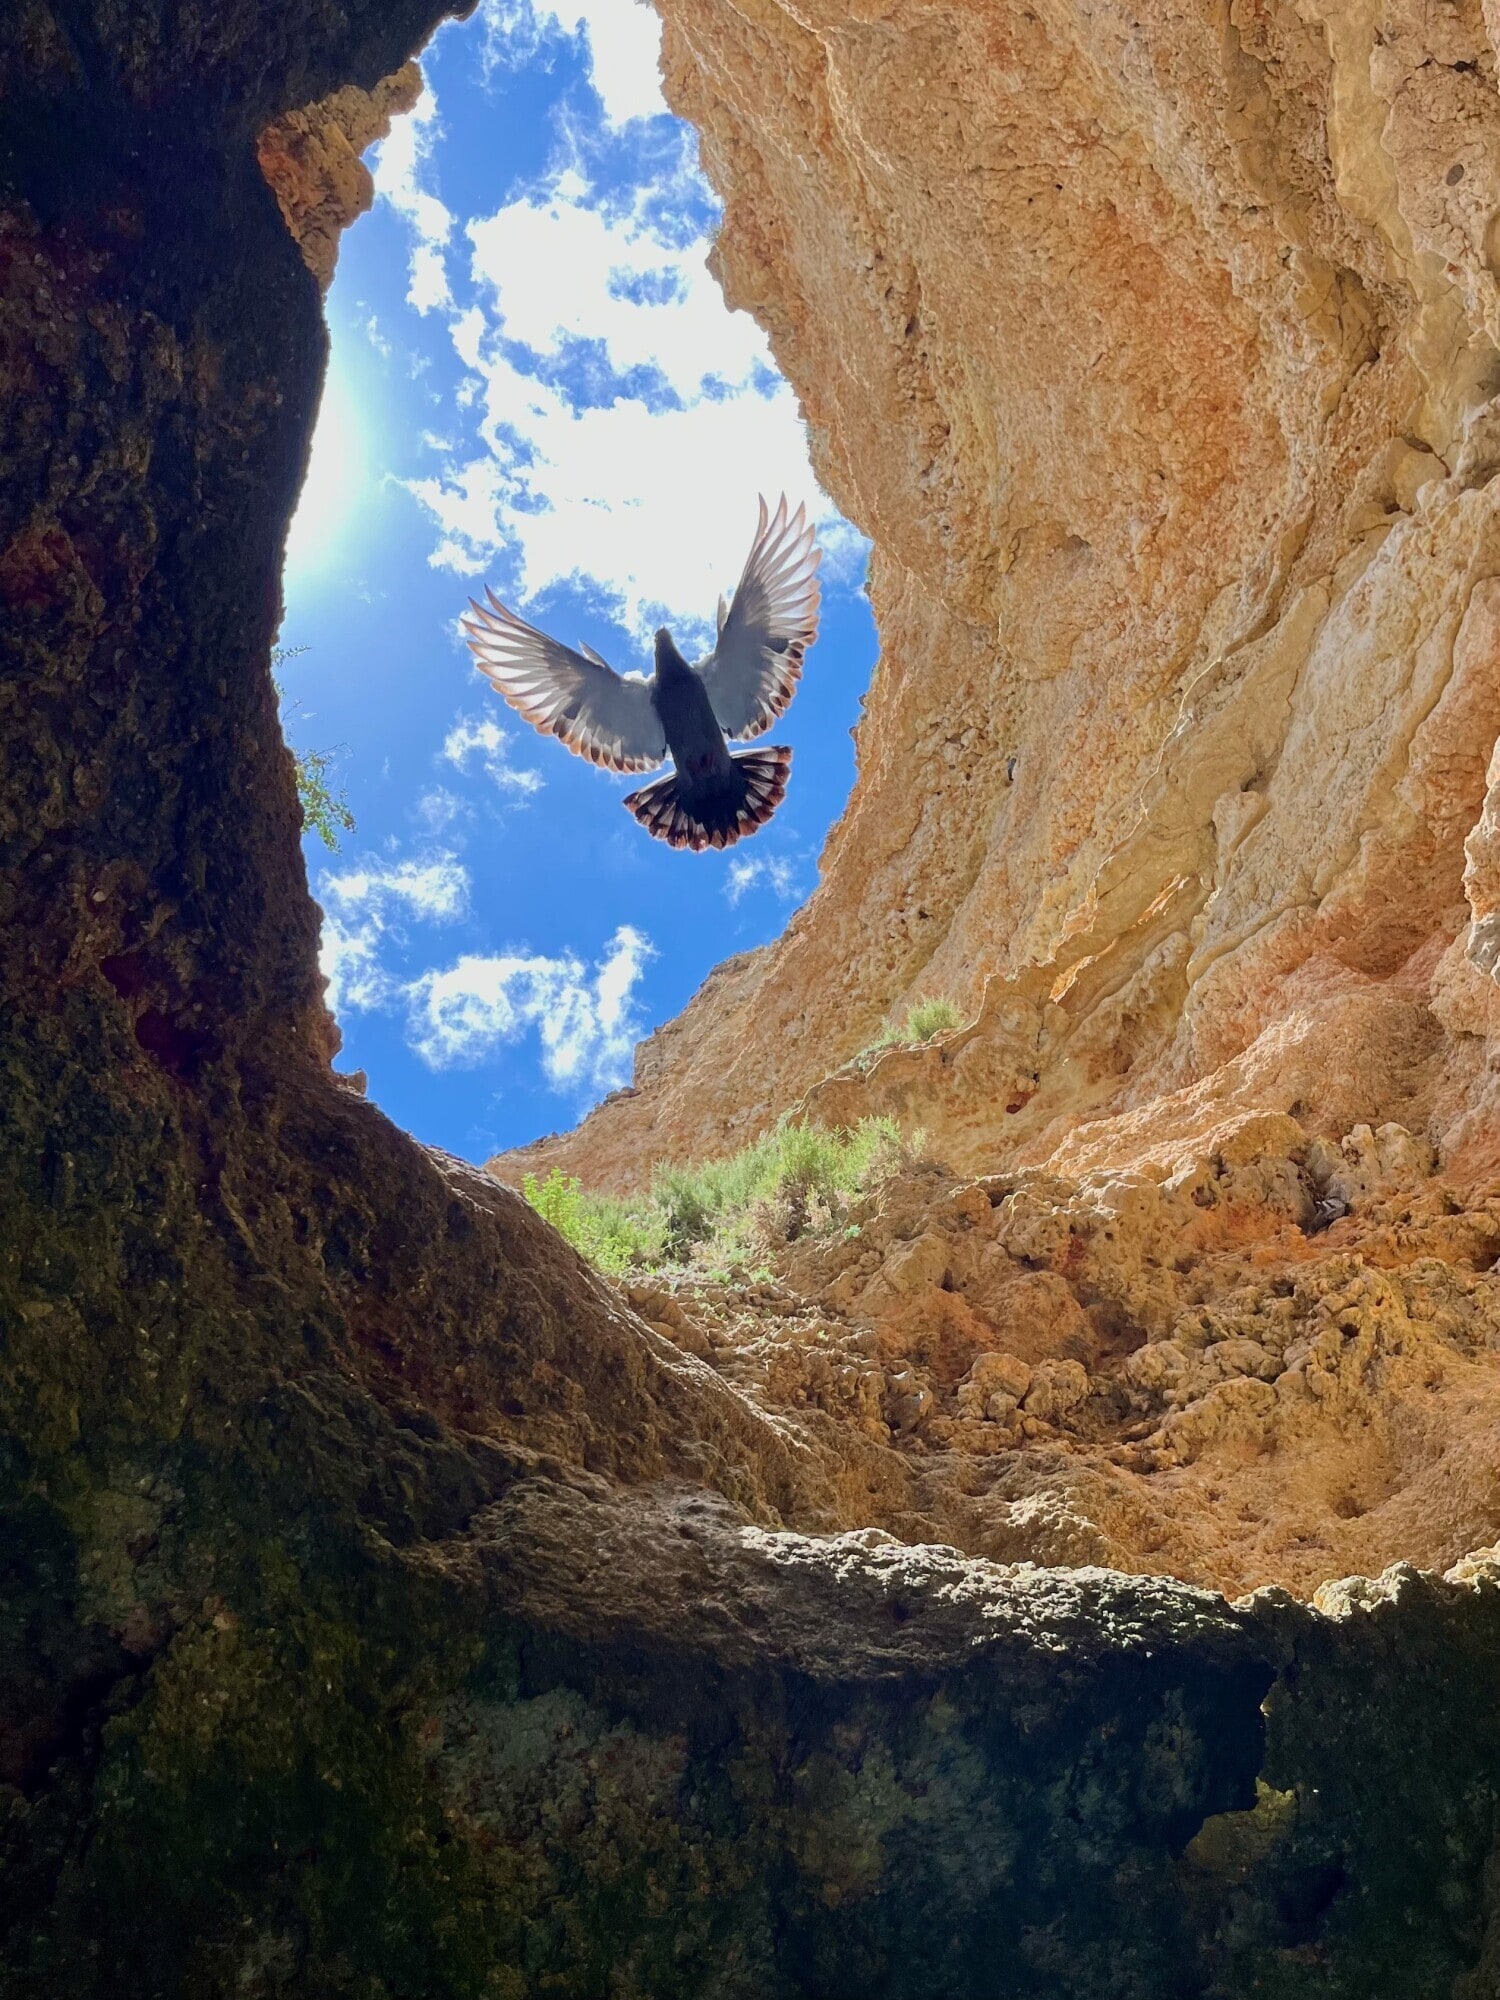
As part of our enlightenment activities aimed at providing increased opportunities to consider biodiversity, eco-life, and the environment through taking photos and/or painting pictures, we have been holding the TEL Eco-Life Art and Photo Contest annually since 2009. The contest, which is held for employees and their families, has attracted more entries every year. As many as 3,867 entries were submitted in fiscal year 2026 by employees and their families in Japan and overseas, with a grand total of approximately 20,000 submissions over the past 17 years.
TEL Eco-Life Art and Photo Contest, Example 1

TEL Eco-Life Art and Photo Contest, Example 2
Green Procurement
Green Procurement Guideline
We have been conducting business operations based on our environmental policy, which aims to conserve the environment and create a global recycling-oriented society. As part of this policy, we issued "Green Procurement Guidelines". We want every supplier to understand our sustainable global environmental conservation activities and these guidelines and provide us with your kind cooperation.
The Substance List (Revised Sep 9, 2026)
We designate substances that are regulated in individual countries, or that we expect to become subject to regulation, as TEL Prohibited Substances. Where our products contain such substances, our policy is to eliminate them or replace them with alternatives promptly. As environmental laws and regulations around the world become more varied and more complex, we have prepared the TEL Substances List, which reflects the latest laws and regulations, and we revise it regularly.
This document provides information on the substances that are prohibited or controlled in our business activities, including their threshold values and the applications covered.
Related Documents
As environmental laws and regulations regarding products are being strengthened, please refer to the following document for our approach and efforts to comply and conform to each law and regulation.
Request for Provision of Environmental Information Regarding Delivered Products
We are researching contained chemical substances used in all parts and products purchased from our suppliers.
Research on Contained Chemical Substance in Articles
We implement contained chemical substances in articles based on the TEL substance list.
We use chemSHERPA-AI* for the research on contained chemical substances in articles. The tool of chemSHERPA-AI can be downloaded from https://chemsherpa.net/english/
If you need more details about the research process, please contact us using the Sustainability inquiry form.
chemSHERPA-AI : The information transmission sheet to be used to communicate information about chemical substances contained in products
Research on Environmental Laws and Regulations
In addition to regulations on contained chemical substances, there are also regulations on energy efficiency and recycling in various countries. We are researching our suppliers and promoting their compliance with these regulations. We appreciate your cooperation.
Decarbonization Measures through Industry Collaboration
We have participated in the Semiconductor Climate Consortium (SCC) of Semiconductor Equipment and Materials International (SEMI) since 2022. As climate action grows more important, the SCC works with its member companies to reduce carbon emissions from the semiconductor industry worldwide. Its Governing Council confirms from a governance standpoint that the SCC’s work is aligned with the Paris Agreement, and we have a representative on that Governing Council.
We also joined the SEMI Energy Collaborative (EC) in 2024. The EC promotes the introduction of clean energy in the Asia-Pacific region, engages in advocacy with policy decision makers and related organizations in each country, and makes various proposals.
Logistics Initiatives
Environmental Considerations in Logistics
Because of worldwide environmental concerns such as global climate change and the rising demand to reduce the environmental burden of logistics activities, transportation regulations are becoming more stringent. We continue to adjust our logistics operations to meet these demands.
CO₂ Reduction Initiatives
As logistics regulations are strengthened to help prevent global warming and address climate change, and as demand grows to reduce the environmental impact of business activities, we are actively pursuing modal shifts*¹ in transportation in Japan and overseas and adopting packaging methods with a lower environmental impact. To track and manage the effect of these efforts, we calculate CO₂ emissions from logistics. For logistics in Japan, we calculate and clarify CO₂ emissions within the scope defined by the Act on the Rational Use of Energy and Conversion into Non-Fossil Fuel, Etc. (Energy Saving Act); for logistics overseas, we calculate and identify CO₂ emissions for our own shipments and for shipments in which our customers are the shippers.
Source: Tokyo Electron BP
- Switching to STW
STW is lightweight and recyclable, and it has a lower environmental impact than wooden packaging. In fiscal year 2026 we worked to meet a goal reducing the proportion of products packed in wood to 40% or less by fiscal year 2027 (packaging of semiconductor production equipment); the proportion came to 52%. We will continue to standardize STW packaging and expand its use with customers as we work to meet the goal.
- Modal shifts and joint delivery
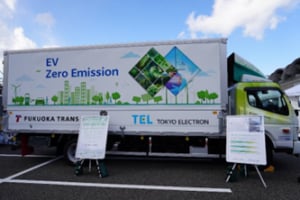
We are working to meet our goal of cutting CO₂ emissions from logistics as a whole (our own shipments) by 30% by fiscal year 2027 through further modal shifts and joint delivery. In fiscal year 2026, in addition to using approximately 800 EV trucks over the year, we converted some vehicles from fossil fuels to biofuels. We also expanded our use of vessels powered by liquefied natural gas, increased ferry utilization to over 90% on long-distance land routes where a modal shift was feasible, and implemented joint delivery by collecting cargo from multiple customers using the same truck. As a result, CO₂ emissions from domestic logistics were approximately 6 kilotons (26%) lower than the estimate for what they would have been without modal shifts and joint delivery.
To meet our annual sustainability goals, we are actively promoting the adoption of STW*² and modal shifts.
We will continue to standardize STW packaging and expand its use with customers, promote further modal shifts and joint delivery, and keep cutting CO₂ emissions so that we meet these goals.
Modal shift: Shifting the means of transportation from trucks and aircraft to rail and ships, which have a lower environmental impact
STW: Strong Triple Wall. Reinforced cardboard made up of three layers
Example initiatives
We are proactively promoting modal shifts to reduce environmental loads. In fiscal 2026, we shifted approximately 5,000 truckloads of cargo to ferry transport between Osaka and Fukuoka and on other ferry routes. Tokyo Electron Miyagi and Tokyo Electron Kyushu have also switched to rail for transporting components. Because modal shifts help ease the “2024 problem”, the driver shortage caused by tighter regulation of truck drivers’ overtime in Japan, we will continue to expand this initiative. We also stepped up transportation by EV truck in fiscal 2026, using approximately 800 EV trucks over the year, more than in the previous year.
Resource-saving Initiatives
Because our customers require a high level of precision and cleanliness during transportation, they must be shipped with care, requiring the use of wooden crates and cardboard boxes. To conserve packaging materials, we use reusable cardboard boxes for packaging. Casters and other specialized transport fixtures used to move products are also collected and returned to our plants for reuse. These initiatives are examples of our ongoing efforts to conserve resources.
Example initiatives
Cutting Resource Use and Transport-related CO₂ through Standardized Parts Packaging
Some of the parts used in our equipment undergo several machining processes at multiple suppliers. By standardizing the packaging for each part so that it can be shared, Tokyo Electron Miyagi reduced the volume of packaging material discarded at each process, improved delivery efficiency, and cut CO₂ emissions from transportation. Specifically, sharing packaging materials that had previously been discarded after each process reduced plastic waste by approximately 10 tons. In addition, eliminating the returnable boxes previously in use removed the need for return transport, reducing truck travel by approximately 600,000 km and CO₂ emissions by about 70 tons. This initiative was recognized as an outstanding sustainability initiative at TEL Sustainability Award 2025, held once a year for all Group employees, and won the Environmental Award.