Sustainability Data
Performance Summary (Social)
The reporting boundary for social data is the Tokyo Electron Group (26 consolidated companies), and the calculating period is fiscal year 2026 (April 1, 2025 to March 31, 2026).
- Japan: Tokyo Electron Ltd., Tokyo Electron Technology Solutions Ltd., Tokyo Electron Kyushu Ltd., Tokyo Electron Miyagi Ltd., Tokyo Electron FE Ltd. and Tokyo Electron BP Ltd.
-
Overseas: 20 consolidated subsidiaries (including Tokyo Electron America, Inc., Tokyo Electron Europe Ltd.,
Tokyo Electron Korea Ltd., Tokyo Electron Taiwan Ltd., Tokyo Electron (Shanghai) Ltd. and Tokyo Electron
Singapore Pte. Ltd.)
● denotes data in the “Sustainability Data 2026” with third-party assurance.
Beginning in fiscal year 2026, totals are calculated based on data for employees who reported their gender and may not match the sum of the figures by gender.
Number of Employees (Entire Group)
| FY2022 | FY2023 | FY2024 | FY2025 | FY2026 | ||
|---|---|---|---|---|---|---|
| Regular employees (Region) |
Number of regular employees | 15,140 | 16,605 | 17,071 | 18,893 | 19,532 |
| Japan | 8,234 | 8,796 | 9,150 | 9,847 | 10,388 | |
| Rest of Asia | 4,328 | 4,819 | 4,854 | 5,640 | 5,833 | |
| Europe and Middle East | 578 | 669 | 708 | 739 | 679 | |
| North America | 2,000 | 2,321 | 2,359 | 2,667 | 2,632 | |
Composition of Employees (Japan)
| FY2022 | FY2023 | FY2024 | FY2025 | FY2026 | ||
|---|---|---|---|---|---|---|
| Employees (Employment type) |
Number of employees | 8,661 | 9,325 | 9,746 | 10,488 | 11,053 |
| Regular employees | 8,234 | 8,796 | 9,150 | 9,847 | 10,388 | |
| Men | 6,944 | 7,429 | 7,716 | 8,279 | 8,708 | |
| Women | 1,290 | 1,367 | 1,434 | 1,568 | 1,678 | |
| Non-regular employees | 427 | 529 | 596 | 641 | 665 | |
| Men | 403 | 490 | 553 | 591 | 608 | |
| Women | 24 | 39 | 43 | 50 | 57 | |
Recruitment/Employment(Japan)
| FY2022 | FY2023 | FY2024 | FY2025 | FY2026 | ||
|---|---|---|---|---|---|---|
| New graduates hired | Number hired | 209 | 231 | 353 | 404 | 543 |
| Under 30 yrs. old | 208 | 231 | 351 | 403 | 541 | |
| Men | 177 | 193 | 304 | 320 | 429 | |
| Women | 31 | 38 | 47 | 83 | 112 | |
| 30–49 yrs. old | 1 | 0 | 2 | 1 | 2 | |
| Men | 0 | 0 | 2 | 1 | 2 | |
| Women | 1 | 0 | 0 | 0 | 0 | |
| 50 yrs. old and over | 0 | 0 | 0 | 0 | 0 | |
| Men | 0 | 0 | 0 | 0 | 0 | |
| Women | 0 | 0 | 0 | 0 | 0 | |
| Percentage of women | 15.3 | 16.5 | 13.3 | 20.5 | 20.6 | |
| Career-track recruits | Number hired | 400 | 580 | 271 | 627 | 312 |
| Under 30 yrs. old | 131 | 209 | 89 | 193 | 96 | |
| Men | 96 | 185 | 72 | 159 | 75 | |
| Women | 35 | 24 | 17 | 34 | 21 | |
| 30–49 yrs. old | 250 | 355 | 172 | 409 | 201 | |
| Men | 202 | 306 | 141 | 339 | 176 | |
| Women | 48 | 49 | 31 | 70 | 25 | |
| 50 yrs. old and over | 19 | 16 | 10 | 25 | 15 | |
| Men | 17 | 13 | 8 | 23 | 11 | |
| Women | 2 | 3 | 2 | 2 | 4 | |
| Percentage of women | 21.3 | 13.1 | 18.5 | 16.9 | 16.0 | |
| Employees with disabilities | Percentage hired (TEL) | 2.32 | 2.03 | 2.18 | 2.44 | 2.32 |
| Percentage hired (Group in Japan) |
2.37 | 2.27 | 2.34 | 2.46 | 2.49 | |
| Reemployment system | Number of users | 389 | 475 | 545 | 586 | 613 |
| Men | 376 | 451 | 510 | 545 | 564 | |
| Women | 13 | 24 | 35 | 41 | 49 | |
| Percentage of regular employees who received regular performance and career evaluations | 100.0 | 100.0 | 100.0 | 100.0 | 100.0 | |
Female managers (Entire Group)
| FY2022 | FY2023 | FY2024 | FY2025 | FY2026 | ||
|---|---|---|---|---|---|---|
| Female Managers*¹*² | Number of people | 163 | 182 | 221 | 253 | 285 |
| Percentage | 5.5 | 5.7 | 6.3 | 6.4 | 6.8 | |
| Number of people (senior directors and above*³) |
10 | 16 | 20 | 21 | 26 | |
| Percentage (senior directors and above*³) |
2.2 | 3.3 | 3.7 | 3.5 | 3.9 | |
Percentage of female managers, calculation method: (Number of female managers/Number of managers) × 100 (The number of managers includes experts and employees reemployed after retirement (from fiscal year 2024).)
As of March 31
Employees of a certain level or position based on the global human resources system
Female managers (Japan)
| FY2022 | FY2023 | FY2024 | FY2025 | FY2026 | ||
|---|---|---|---|---|---|---|
| Female managers*¹*² | Number of people | 46 | 51 | 67 | 77 | 96 |
| Percentage | 2.6 | 2.7 | 3.1 | 3.3 | ●3.8 | |
Percentage of female managers, calculation method: Number of female managers/Number of managers × 100 (The number of managers includes experts and employees reemployed after retirement (from fiscal year 2024).)
As of March 31
Employee retention (Japan)
| FY2022 | FY2023 | FY2024 | FY2025 | FY2026 | ||
|---|---|---|---|---|---|---|
| Employee retention |
Retention after three years of joining TEL* | 94.7 | 92.7 | 93.1 | 94.6 | 94.9 |
| Men | 95.0 | 93.2 | 93.6 | 95.0 | 95.2 | |
| Women | 93.5 | 90.6 | 90.9 | 92.1 | 93.2 | |
| Average service years | 17 yrs. 2 mos. | 16 yrs. 8 mos. | 16 yrs. 6 mos. | 15 yrs. 10 mos. | 15 yrs. 7 mos. | |
| Men | 17 yrs. 6 mos. | 16 yrs. 10 mos. | 16 yrs. 8 mos. | 16 yrs. 0 mos. | 15 yrs. 8 mos. | |
| Women | 15 yrs. 8 mos. | 15 yrs. 7 mos. | 15 yrs. 7 mos. | 14 yrs. 11 mos. | 14 yrs. 9 mos. | |
Average in recent five years
Employee turnover (Entire Group)
| FY2022 | FY2023 | FY2024 | FY2025 | FY2026 | |||||||||
|---|---|---|---|---|---|---|---|---|---|---|---|---|---|
| Voluntary resignation | Retirement | Voluntary resignation | Retirement | Voluntary resignation | Retirement | Voluntary resignation | Retirement | Voluntary resignation | Retirement | ||||
| Turnover | Employee turnover | 589 | 53 | 599 | 50 | 415 | 37 | 431 | 61 | 432 | 35 | ||
| Men | 507 | 47 | 509 | 46 | 351 | 31 | 347 | 52 | 354 | 30 | |||
| Women | 82 | 6 | 90 | 4 | 64 | 6 | 83 | 9 | 78 | 5 | |||
| Turnover percentage | 4.2 | ー | 3.9 | ー | 2.5 | ー | 2.4 | ー | 2.2 | ー | |||
| Overall turnover rate | 4.5 | 4 | 2.9 | 3.2 | 2.4 | ||||||||
Employee Turnover (Japan)
| FY2022 | FY2023 | FY2024 | FY2025 | FY2026 | |||||||||
|---|---|---|---|---|---|---|---|---|---|---|---|---|---|
| Voluntary resignation | Retirement | Voluntary resignation | Retirement | Voluntary resignation | Retirement | Voluntary resignation | Retirement | Voluntary resignation | Retirement | ||||
| Turnover | Employee turnover | 87 | 15 | 98 | 17 | 113 | 8 | 95 | 12 | 104 | 8 | ||
| Men | 69 | 15 | 81 | 17 | 93 | 6 | 76 | 10 | 86 | 8 | |||
| Women | 18 | 0 | 17 | 0 | 20 | 2 | 19 | 2 | 18 | 0 | |||
| Turnover percentage | 1 | ー | 1.1 | ー | 1.2 | ー | 0.9 | ー | 0.9 | ー | |||
| Overall turnover rate | 1.2 | 1.3 | 1.3 | 1.1 | 1 | ||||||||
Work-life Balance (Japan)
| FY2022 | FY2023 | FY2024 | FY2025 | FY2026 | ||
|---|---|---|---|---|---|---|
| Annual paid leave | Take-up rate*¹ | 64.6 | 70.0 | 80.6 | 78.9 | ●78.0 |
| Refreshment leave | Number of those who took leave | 512 | 1,731 | 630 | 819 | 1,950 |
| Men | 435 | 1,485 | 547 | 697 | 1,670 | |
| Women | 77 | 246 | 83 | 122 | 279 | |
| Paternity leave | Number of those who took leave | 137 | 149 | 169 | 161 | 192 |
| Childcare leave | Number of those who took leave | 70 | 96 | 153 | 213 | 279 |
| Men | 36 | 57 | 122 | 167 | 228 | |
| Women (percentage who took leave) |
34 (97.1) |
39 (97.5) |
31 (100) |
46 (97.9) |
51 (100) |
|
| Number of those who returned to work after leave | 60 | 76 | 155 | 173 | 256 | |
| Men | 32 | 43 | 120 | 150 | 220 | |
| Women | 28 | 33 | 35 | 23 | 36 | |
| Percentage reinstated | 95.2 | 98.7 | 100.0 | 99.4 | 99.2 | |
| Retention rate | 90.0 | 97.9 | 91.2 | 96.7 | 94.7 | |
| Shorter working hour system |
Number of those who used | 110 | 105 | 103 | 90 | 90 |
| Men | 7 | 10 | 10 | 14 | 12 | |
| Women | 103 | 95 | 93 | 76 | 78 | |
| Leave to care for a sick /injured child, etc | Number of those who took leave | 547 | 599 | 661 | 695 | 1,033 |
| Men | 373 | 424 | 513 | 555 | 823 | |
| Women | 174 | 175 | 148 | 140 | 210 | |
| Childcare support leave | Number of those who took leave | 80 | 98 | 113 | 121 | 136 |
| Men | 23 | 33 | 45 | 77 | 61 | |
| Women | 57 | 65 | 68 | 44 | 75 | |
| Extended nursing care leave | Number of those who took leave | 1 | 4 | 6 | 3 | 3 |
| Men | 0 | 4 | 5 | 2 | 1 | |
| Women | 1 | 0 | 1 | 1 | 2 | |
| Short nursing care leave | Number of those who took leave | 87 | 85 | 100 | 134 | 170 |
| Men | 57 | 53 | 54 | 81 | 100 | |
| Women | 30 | 32 | 46 | 53 | 70 | |
| Shorter working hour system for nursing care |
Number of those who used | 4 | 0 | 1 | 2 | 2 |
| Men | 2 | 0 | 1 | 2 | 1 | |
| Women | 2 | 0 | 0 | 0 | 1 | |
| Spousal transfer leave system | Number of those who used | — | — | 3 | 7 | 7 |
| Men | — | — | 0 | 0 | 2 | |
| Women | — | — | 3 | 7 | 5 | |
Take-up rate of annual paid leave, calculation method: (Days of paid leave taken by employees*²) / (Days of paid leave provided to employees*²) × 100
Incl. non-regular employees
Products/Innovation (Entire Group)
| FY2022 | FY2023 | FY2024 | FY2025 | FY2026 | ||
|---|---|---|---|---|---|---|
|
Total number of incidents of non-compliance with regulations and voluntary codes concerning the
health and safety impacts of products and services
|
0 | 0 | 0 | 0 | 0 | |
| Active issued patents (Region/Country)*¹ | Number of active issued patents | 19,572 | 21,645 | 23,249 | 24,996 | 26,592 |
| Japan | 5,703 | 6,307 | 6,715 | 7,069 | 7,401 | |
| U.S. | 4,988 | 5,360 | 5,603 | 5,803 | 6,177 | |
| Europe | 167 | ー*² | ー*² | ー*² | ー*² | |
| Korea | 3,731 | 4,683 | 5,111 | 5,717 | 6,177 | |
| Taiwan | 3,014 | 3,120 | 3,326 | 3,541 | 3,807 | |
| China | 1,969 | 2,175 | 2,494 | 2,866 | 3,030 | |
Figures for fiscal year 2022 are based on our database; figures for fiscal year 2023 onwards are based on LexisNexis® PatentSight+ database.
Europe is not included in the boundary.
| 2020.12 | 2021.12 | 2022.12 | 2023.12 | 2024.12 | ||
|---|---|---|---|---|---|---|
| Global patent application rate*¹ | 74.6 | 80.1*² | 79.9*² | 77.3*² | 76.2 | |
Percentage applied for in countries other than Japan of the number of inventions leading to patents in each calendar year.
Added international applications filed under the Patent Cooperation Treaty (PCT) to applications filed in other countries.
| 2021.12 | 2022.12 | 2023.12 | 2024.12 | 2025.12 | ||
|---|---|---|---|---|---|---|
Patent application success rate* |
Japan | 79.8 | 74.5 | 81.8 | 77.9 | 83.6 |
| U.S. | 83.9 | 81.5 | 80.7 | 86.1 | 83.3 |
Percentage of patent applications that have been allowed among those that have completed examination each calendar year.
Customer (Entire Group)
| FY2022 | FY2023 | FY2024 | FY2025 | FY2026 | |
|---|---|---|---|---|---|
| Percentage of respondents who selected "Very Satisfied" or "Satisfied" in the customer satisfaction survey | 100.0 | 100.0 | 100.0 | 100.0 | 100.0 |
Safety (Entire Group)
| FY2022 | FY2023 | FY2024 | FY2025 | FY2026 | |
|---|---|---|---|---|---|
| Percentage of employees who received training on basic safety | 100 | 100 | 100 | 100 | 100 |
| Percentage of employees who received training on advanced safety | 100 | 100 | 100 | 100 | 100 |
| Lost time incident rate per 1,000,000 work hours (LTIR) | 0.66 | 0.83 | 0.31 | 0.32 | 0.36 |
| Number of workplace incidents per 200,000 work hours (TCIR) | 0.30 | 0.33 | 0.15 | 0.23 | 0.22 |
Procurement (Entire Group)
| FY2022 | FY2023 | FY2024 | FY2025 | FY2026 | |
|---|---|---|---|---|---|
| Percentage of new important suppliers screened using social criteria | 100 | 100 | 100 | 100 | 100 |
| Rate of improvement after supply chain sustainability assessment | 31.5 | 30.5 | 29.2 | ー*¹ | ー*¹ |
| Rate of improvement after supply chain BCP assessment | 24.4 | 22.2 | 20.4 | 19.3 | 24.1 |
| Number of identified RMAP conformant smelters (rate of identification) |
243(100) | 234(100) | 238(100) | 298(99)*² | 293(99) |
Comparison not possible due to revision of questionnaire
Cobalt added to the 3TG (tantalum, tin, tungsten and gold) target minerals from the fiscal year 2025 survey.
Governance (Non-consolidated)
| FY2022 | FY2023 | FY2024 | FY2025 | FY2026 | ||
|---|---|---|---|---|---|---|
| Total number of critical incidents notified to the Board of Directors | 0 | 0 | 0 | 0 | 1 | |
| Total number of incidents subject to legal action on the basis of anti-competitive conduct, antitrust activity or monopolistic practices where the governance body’s involvement was revealed | 0 | 0 | 0 | 0 | 0 | |
| Number of executive officers who received training on anti-corruption1*¹ | 20 | 28 | 0 | 26 | 4 | |
| Total number (percentage) of directors who provided instructions on the body’s policies and procedures in relation to anti-corruption*¹ | 12 (100) |
6 (100) |
6 (100) |
7 (100) |
8 (100) |
|
| Total number (percentage) of directors who received training on anti-corruption*¹ | 0 (0) |
3 (50) |
0 (0) |
3 (42.8) |
0 (0) |
|
| Payment to industry groups, etc. (thousand yen)*² | 56,374 | 73,313 | 82,263 | 93,599*³ | 99,492 | |
| Payment to politically affiliated organizations (yen) | 0 | 0 | 0 | 0 | 0 | |
| Average tenure of directors | 6.58 | 5.16 | 6.16 | 5.57 | 5.12 | |
| Average rate of attendance for Board of Directors | 99.50 | 98.62 | 99.09 | 99.15 | 98.43 | |
| Corporate directors |
Number of corporate directors | 12 | 6 | 6 | 7 | 8 |
| Inside corporate directors | 8 | 3 | 3 | 3 | 3 | |
| Men | 8 | 3 | 3 | 3 | 3 | |
| Women | 0 | 0 | 0 | 0 | 0 | |
| Outside corporate directors | 4 | 3 | 3 | 4 | 5 | |
| Men | 2 | 1 | 1 | 2 | 3 | |
| Women | 2 | 2 | 2 | 2 | 2 | |
| Executive officers |
Number of executive officers | 23 | 26 | 30 | 39 | 41 |
| Men | 23 | 25 | 29 | 38 | 40 | |
| Women | 0 | 1 | 1 | 1 | 1 | |
Boundary: Japan
Payment to industry groups, etc”are intended to support activities in the semiconductor industry and promote sustainability. In fiscal year 2026, the major expenditures consisted of annual membership fees paid to industry associations, including ¥16,715 thousand to SEMI (Semiconductor Equipment and Materials International), ¥15,000 thousand to SEAJ (Japan Semiconductor Equipment Association), and ¥8,219 thousand to the Responsible Business Alliance (RBA).
Some figures revised
Compliance (Entire Group)
| FY2022 | FY2023 | FY2024 | FY2025 | FY2026 | ||
|---|---|---|---|---|---|---|
| Education on TEL’s Code of Ethics/pledge rate*¹ | 91.6 | 96.1 | 94.9*² | 96.7 | 96.5 | |
| Percentage of employees who have consented to the information security agreement | 99.9 | 100.0 | 99.3 | 100.0 | 100.0 | |
| Significant fines and non-monetary sanctions for non-compliance with laws and regulations in the social and economic area | 0 | 0 | 0 | 0 | 0 | |
| Number of cases that lead to disciplinary action due to compliance infractions*¹*³ | ー | ー | 59 | 43 | 83 | |
| Bribery/Corruption | ー | ー | 0 | 0 | 0 | |
| Competition Act/Anti-Monopoly Act | ー | ー | 0 | 0 | 0 | |
| Money laundering/Insider trading | ー | ー | 0 | 0 | 0 | |
| Information security/Intellectual property | ー | ー | 3 | 1 | 17 | |
| Personal information, including customer privacy data |
ー | ー | ー | 0 | 0 | |
| Conflicts of interest | ー | ー | 0 | 0 | 1 | |
| Harassment | ー | ー | 22 | 12 | 19 | |
| Other (Violations of service obligations) | ー | ー | 34 | 30 | 46 | |
Scope: Entire Group
Period is from March to May 2024
Includes violations of the Tokyo Electron Group Code of Ethics, company regulations, etc.
Social Contribution (Entire Group)
| FY2022 | FY2023 | FY2024 | FY2025 | FY2026 | ||
|---|---|---|---|---|---|---|
| Spending on social contribution (million yen) *¹ | 170 | 301 | 533 | 601 | 408*² | |
Spending on social contribution activities excluding disaster relief contributions
Review of target scope implemented from fiscal year 2026
Performance Summary (Environment)
The reporting boundary for environmental data is the Tokyo Electron Group (26 consolidated companies), and the calculating period is fiscal year 2026 (April 1, 2025 to March 31, 2026).
- Japan: Tokyo Electron Ltd., Tokyo Electron Technology Solutions Ltd., Tokyo Electron Kyushu Ltd., Tokyo Electron Miyagi Ltd., Tokyo Electron FE Ltd. and Tokyo Electron BP Ltd.
- Overseas: 20 consolidated subsidiaries (including Tokyo Electron America, Inc., Tokyo Electron Europe Ltd., Tokyo Electron Korea Ltd., Tokyo Electron Taiwan Ltd., Tokyo Electron (Shanghai) Ltd. and Tokyo Electron Singapore Pte. Ltd.)
● denotes data in the “Sustainability Data 2026” with third-party assurance.
Totals may not match due to rounding.
Greenhouse Gas Emissions*¹ (Entire Group)
| FY2022 | FY2023 | FY2024 | FY2025 | FY2026 | ||
|---|---|---|---|---|---|---|
| Scope 1 emissions | Scope 1 emissions (kt-CO₂) | 16 | 22 | 21 | 22 | ●28 |
| Energy-derived (kt-CO₂)*² | 12 | 12 | 12 | 13 | ●15 | |
| Japan | 10 | 10 | 10 | 11 | 13 | |
| Overseas | 2 | 2 | 2 | 2 | 2 | |
| Non-energy-derived greenhouse gas emissions total*³ (kt-CO₂e) | 4 | 10 | 9 | 9 | ●13 | |
| Non-energy-derived greenhouse gas emissions (kt-CO₂e)(Japan) | 4 | 10 | 9 | 9 | 13 | |
| Japan-HFCs | 0.7 | 3.4 | 2.3 | 1.9 | 3.6 | |
| Japan-PFCs | 1.3 | 5.6 | 4.8 | 4.4 | 7.8 | |
| Japan-SF₆ | 1.4 | 1.2 | 1.1 | 1.6 | 1.1 | |
| Japan-Other | 0.4 | 0.2 | 0.4 | 0.8 | ー | |
| Japan-CO₂ | ー | ー | ー | ー | 0.5 | |
| Japan-CH₄ | ー | ー | ー | ー | 0.0 | |
| Japan-N₂O | ー | ー | ー | ー | 0.0 | |
| Japan-NF₃ | ー | ー | ー | ー | 0.0 | |
| Non-energy-derived greenhouse gas emissions (kt-CO₂e) (Overseas) | 0.1 | 0.0 | 0.0 | 0.1 | 0.0 | |
| Overseas-HFCs | 0.0 | 0.0 | 0.0 | 0.0 | 0.0 | |
| Overseas-PFCs | 0.0 | 0.0 | 0.0 | 0.0 | 0.0 | |
| Overseas-SF₆ | 0.0 | 0.0 | 0.0 | 0.0 | 0.0 | |
| Overseas-Other | 0.1 | 0.0 | 0.0 | 0.0 | ー | |
| Overseas-CO₂ | ー | ー | ー | ー | 0.0 | |
| Overseas-CH₄ | ー | ー | ー | ー | 0.0 | |
| Overseas-N₂O | ー | ー | ー | ー | 0.0 | |
| Overseas-NF₃ | ー | ー | ー | ー | 0.0 | |
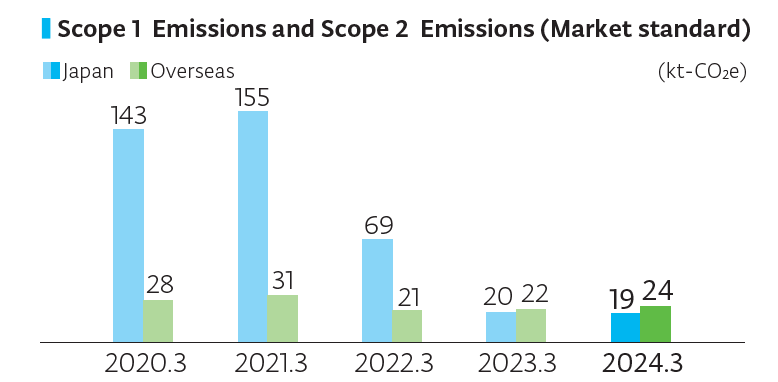
| Scope 2 emissions | Scope 2 emissions (Market based*⁴)(kt-CO₂) | 74 | 20 | 22 | 25 | ●35 |
| Japan | 55 | 0 | 0 | 0 | 0.0*⁵ | |
| Overseas | 19 | 20 | 22 | 25 | 35 | |
| Scope 2 emissions (Location based*⁶) (kt-CO₂) | 168 | 180 | 192 | 200 | 223 | |
| Japan | 136 | 144 | 155 | 158 | 171 | |
| Overseas | 33 | 36 | 37 | 42 | 52 | |
| Scope 3*⁷ emissions | Scope 3 emissions (kt-CO₂) | 12,614 | 14,335 | 11,770 | 12,389 | 14,203 |
|
Category 1*⁸
Purchased goods and services
|
3,332 | 4,053 | 3,239 | 4,494 | ●5,215 | |
|
Category 2*⁹
Capital goods
|
172 | 224 | 366 | 490 | 650 | |
|
Category 3*10
Fuel- and energy-related activities
not included in Scope 1 or 2 |
27 | 29 | 31 | 34 | 78 | |
|
Category 4*11
Transportation and distribution
(upstream) |
15 | 19 | 12 | 16 | 24 | |
|
Category 5*12
Waste generated in operations
|
2 | 3 | 3 | 3 | 6 | |
|
Category 6*13
Business travel
|
7 | 14 | 27 | 67 | 49 | |
| Category 7*14 Employee commuting |
21 | 14 | 15 | 29 | 7 | |
| Category 9*15 Downstream transportation and distribution |
121 | 120 | 65 | 135 | 86 | |
| Category 11*16 Use of sold products |
8,911*18 | 9,854 | 8,009*18 | 7,116*18 | ●8,080 | |
| Category 12*17 End-of-life treatment of sold products |
5 | 5 | 4 | 6 | 7 | |
| Scope 1,2*19 emissions total |
Scope 1, 2(Market based)*19 emissions (kt-CO₂) | 90 | 42 | 43 | 47 | 63 |
| Scope 1,2*19,3 emissions total |
Scope 1, 2(Market based)*19 emissions, 3 emissions (kt-CO₂) | 12,704*18 | 14,377 | 11,813*18 | 12,436*18 | 14,266 |
GHG emissions quantification is subject to uncertainty when measuring activity data, determining emission factors, and considering scientific uncertainty inherent in the Global Warming Potentials.
The financial control approach is used as the consolidation approach. Tokyo Electron Ltd. and all consolidated subsidiaries are included in the reporting boundary.
Scope 1: Direct GHG emissions from sources owned or controlled by the company, including emissions from fuel and gas consumption.
Calculation method: Emissions = Σ (fuel consumed × CO₂ emission factor).
For fuels other than city gas, CO₂ emission factors under Japan’s Act on Promotion of Global Warming Countermeasures are used. For city gas, emissions are calculated using emission factors based on the Act for Japan and publicly available emission factors published in each overseas location.
Scope 1: Non-energy-derived CO₂ and GHG other than CO₂.: seven gases (CO₂, CH₄, N₂O, HFCs, PFCs, SF₆ and NF₃).
Calculation method: Emissions = Σ (consumption × emission per unit consumption – amount recovered and properly treated) × global warming factor.
Global Warming Potentials for fiscal 2026 are based on the IPCC Sixth Assessment Report (AR6) factor values, which are used to calculate emissions in CO₂ equivalent. The effects of abatement equipment, etc., is also considered. are applied using removal efficiency based on actual measurements or specifications. From fiscal 2026, emissions of PFCs and other gases generated as byproducts during the use of GHGs in product evaluation processes, etc. are included in the calculation to improve the accuracy of GHG emissions calculation.
Scope 2 (market based): Indirect GHG emissions from use of electricity we purchased.
Calculation method: Emissions = Σ (purchased electricity × CO₂ emission factor).
Basic emission factors for the electrical power providers concerned based on Japan's Act on Promotion of Global Warming Countermeasures were used as the emission factor for Japan.
For the emission factors of countries other than Japan, specific emission factors for each contracted electric power provider or supply contract are used. If specific emission factors are not available, residual mix, regional/country grid factors, or emission factors from the Emissions Factors 2025 edition published by the International Energy Agency (IEA) (country average emission factors) are used. Renewable electricity backed by Non-Fossil Certificates, RECs, etc. is treated as zero emissions for the relevant amount. For steam, emission factors for each heat supplier are used. Beginning in fiscal year 2026, emissions related to transmission and distribution losses, which were previously included in Scope 2, are excluded using the country-specific transmission and distribution loss rates published by the World Bank. GHGs other than CO₂ are also included using the respective CH₄ and N₂O emission factors by country and gas from the Emissions Factors 2025 edition.
Figure after Non-Fossil Certificate Equivalent Amount Deduction.
Scope 2 emissions prior to Non-fossil Certificate Equivalent Amount Deduction is 10 kt-CO₂; Non-fossil Certificate Equivalent Amount is 10 kt-CO₂.
Scope 2 (location based): Indirect GHG emissions from use of electricity and steam we purchased.
Calculation method: Emissions = (purchased electricity × CO₂ emission factor).
For Japan, national average emission factors under Japan’s Act on Promotion of Global Warming Countermeasures are used, and for overseas, IEA country-specific factors (country average emission factors) are used. For steam, emission factors for each heat supplier are used. Beginning in fiscal 2026, emissions related to transmission and distribution losses, which were previously included in Scope 2, are excluded using the country-specific transmission and distribution loss rates published by the World Bank. GHGs other than CO₂ are also included using the respective CH₄ and N₂O emission factors by country and gas from the Emissions Factors 2025 edition.
Scope 3: Emissions from the company’s value chain excluding Scope 1 and Scope 2, such as product transportation, employee business travel and major outsourced production processes.
The entire scope is divided into 15 categories, of which calculations were made for categories 1, 2, 3, 4, 5, 6, 7, 9, 11 and 12. Calculations for categories 8,10, 13, 14 and 15 were not made as there are no applicable activities or have already been included in other categories.
For Japan, emissions are calculated by multiplying purchased amounts by the input-output table emission factors (producer price basis) in the Emission Intensity Database for Calculating Greenhouse Gas Emissions, etc. of Organizations through the Supply Chain ver. 3.6 (Environment Ministry DB). For suppliers accounting for the top 90%, calculations are made by linking major representative items, and for the bottom 10%,calculations are made by estimation. For overseas, TEL Manufacturing and Engineering of America, Inc. in the U.S. calculates emissions using U.S. USEEIO (US Environmentally-Extended Input-Output) Ver. 1.4, and procurement by other companies is calculated based on extrapolation from the calculations for Japan. Emissions related to services are calculated by multiplying the relevant expenses by emission factors from the Environment Ministry DB. Water consumption is calculated using values from IDEA (Inventory Database for Environmental Analysis: an LCA database provided by the National Institute of Advanced Industrial Science and Technology) v3.5. For procurement for which transportation costs cannot be separated from purchased amounts, emissions associated with transportation are included in this category.
Calculated by multiplying capital expenditures in fiscal 2026 by emission factors for capital goods (Environment Ministry DB).
Calculated by multiplying physical quantity data for fuel, electricity, heat, etc. we purchased by emission factors from IDEA v3.5 for the stages from resource extraction through transportation. The calculation uses Scope 2 (Location based) figures.
Emissions from transportation are calculated in accordance with the calculation guidelines under the Energy Conservation Act. For truck transportation, the improved ton-kilometer method, which takes loading rate into account, is used. For transportation other than trucks (marine, air, etc.), the conventional ton-kilometer method (without loading rate correction) is applied. Emissions are calculated by multiplying activity data, obtained by multiplying transport volume (freight tons) by transportation distance, by emission factors for each transportation method.
Waste generated in operations is identified by type and treatment method (landfill, incineration, recycling, etc.), and emissions are calculated using emission factors from IDEA v3.5.
Calculated by collecting monetary data for expenses related to employee business travel (airline tickets, trains, etc.) and applying emission factors (Environment Ministry DB) to expenditures by transportation method.
Calculated by collecting monetary data for transportation expenses paid for employee commuting (trains, gasoline, etc.) and applying emission factors (Environment Ministry DB) to expenditures by transportation method. For sites for which transportation expenses and transportation methods are unknown, calculations are made by applying per-employee emission intensities (Environment Ministry DB) to the number of employees.
In calculating emissions from downstream transportation, the ton-kilometer method is applied, as with Category 4 upstream transportation, and calculations are made by using transport volume (freight tons) × transportation distance as activity data and multiplying it by emission factors by transportation method.
Annual electricity consumption and GHG emissions derived from process gas are calculated for each item of equipment in accordance with the SEMI S23 standard, and emissions are calculated by multiplying those figures by the number of units shipped in fiscal 2026 and the assumed use period (10 years). For electricity emission factors, for products sold to six major customers, emission factors calculated from the values publicly disclosed by each customer are applied, while for products sold to other customers, calculations are made using IEA country-specific emission factors according to the product use region. For fiscal 2026, GHG emissions derived from process gas are calculated in CO₂ equivalent using GWP values from the IPCC Sixth Assessment Report (AR6).
Based on product shipment weight, emissions are calculated using emission factors from IDEA v3.5 for assumed treatment methods (landfill, incineration, recycling, etc.).
Updated figures due to revisions in the calculation method.
Scope 2 is based on the market-based method.
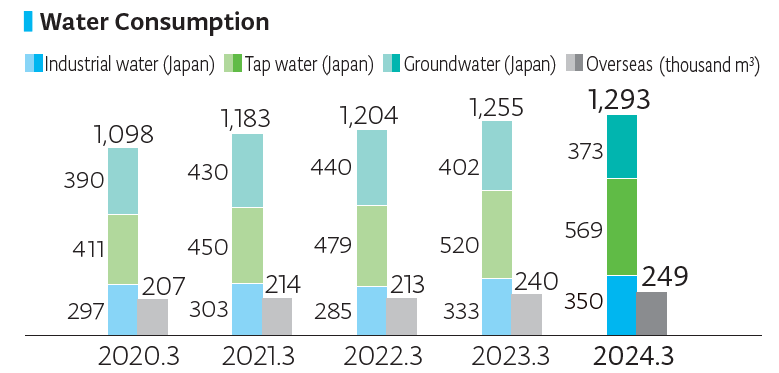
Water-Related Data (Entire Group)
| FY2022 | FY2023 | FY2024 | FY2025 | FY2026 | ||
|---|---|---|---|---|---|---|
| Water | Water intake (thousandm³) | 1,417 | 1,495 | 1,542 | 1,587 | 2,077 |
| Japan | 1,204 | 1,255 | 1,293 | 1,288 | ●1,669 | |
| Groundwater | 440 | 402 | 373 | 394 | 546 | |
| Tap water | 479 | 520 | 569 | 579 | 599 | |
| Industrial water | 285 | 333 | 350 | 315 | 524 | |
| Overseas | 213 | 240 | 249 | 298 | 408 | |
| Water consumption (thousand m³) | 223 | 223 | 221 | 398 | 627 | |
| Japan | 195 | 193 | 196 | 362 | 556 | |
| Overseas | 28 | 30 | 24 | 36 | 71 | |
| Water discharge (thousand m³) | 1,194 | 1,272 | 1,321 | 1,188 | 1,450 | |
| Japan | 1,009 | 1,062 | 1,096 | 926 | 1,114 | |
| Overseas | 185 | 210 | 225 | 262 | 336 | |
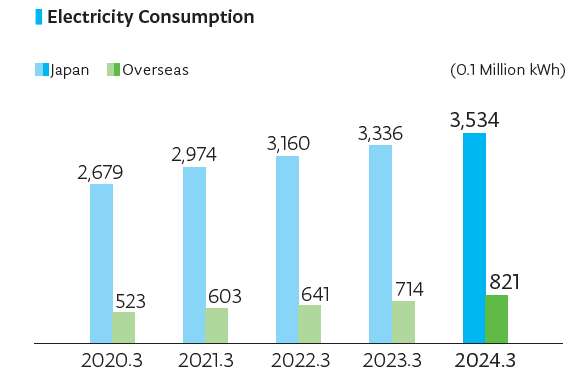
Energy Consumption and Generation (Entire Group)
| FY2022 | FY2023 | FY2024 | FY2025 | FY2026 | ||
|---|---|---|---|---|---|---|
| Energy | Consumption metric (MWh) (sales) (MWh/billion yen) | 2.19 | 2.10 | 2.71 | 2.21 | 2.54 |
| Consumption (MWh) |
439,465 | 464,234 | 496,107 | 537,978 | ●620,995 | |
| Japan | 362,852 | 379,750 | 402,788 | 428,436 | 487,018 | |
| Overseas | 76,613 | 84,484 | 93,319 | 109,542 | 133,977 | |
| Electricity | Consumption (MWh) | 380,127 | 404,964 | 435,514 | 471,956 | ●539,673 |
| Japan*³ | 316,017 | 333,572 | 353,428 | 376,974 | 425,924 | |
| Overseas | 64,110 | 71,392 | 82,086 | 94,982 | 113,749 | |
| Gas (city gas, LPG) |
Consumption (MWh*¹) |
40,870 | 41,968 | 40,787 | 42,801 | ●53,179 |
| Japan | 29,479 | 29,888 | 30,682 | 33,053 | 41,379 | |
| Overseas | 11,391 | 12,080 | 10,105 | 9,748 | 11,800 | |
| Fuel (heavy oil A, diesel oil, kerosene, gasoline) | Consumption (MWh) |
17,496 | 16,430 | 18,808 | 18,538 | ●19,817 |
| Japan | 17,356 | 16,290 | 18,678 | 18,409 | 19,714 | |
| Overseas | 140 | 140 | 130 | 129 | 103 | |
| Purchase of steam*¹ | Consumption (MWh) | 972 | 872 | 998 | 4,683 | ●8,326 |
| Japan | 0 | 0 | 0 | 0 | 0 | |
| Overseas | 972 | 872 | 998 | 4,683 | 8,326 | |
| Renewable energy (electricity) | Purchase (MWh) | 227,523 | 365,876 | 390,546*² | 416,835*² | 465,295*² |
| Japan | 197,137 | 330,791 | 350,591*² | 374,315*² | 423,103*² | |
| Overseas | 30,386 | 35,085 | 39,955 | 42,521*² | 42,192*² | |
| Solar power generation system | Power generation (MWh) | 3,890 | 4,110 | 3,901 | 3,820 | 4,047 |
| Japan | 3,890 | 4,110 | 3,901 | 3,802 | 3,858 | |
| Overseas | 0 | 0 | 0 | 18 | 189 | |
| Self-consumption volume (MWh) | 2,695 | 2,780 | 2,837 | 2,677 | 3,010 | |
| Japan | 2,695 | 2,780 | 2,837 | 2,659 | 2,821 | |
| Overseas | 0 | 0 | 0 | 18 | 189 | |
| Power sales (MWh)*³ | 1,195 | 1,330 | 1,063 | 1,143 | 1,037 | |
| Japan | 1,195 | 1,330 | 1,063 | 1,143 | 1,037 | |
| Overseas | 0 | 0 | 0 | 0 | 0 | |
| Renewable energy (electricity) use rate | Electricity use rate (%) | 60 | 91 | 90 | 89 | 87 |
| Japan | 63 | 100 | 100 | 100 | 100 | |
| Overseas | 47 | 49 | 49 | 45 | 37 | |
Added steam purchases overseas
Updated figures due to revisions in the calculation method.
Heat and steam not sold
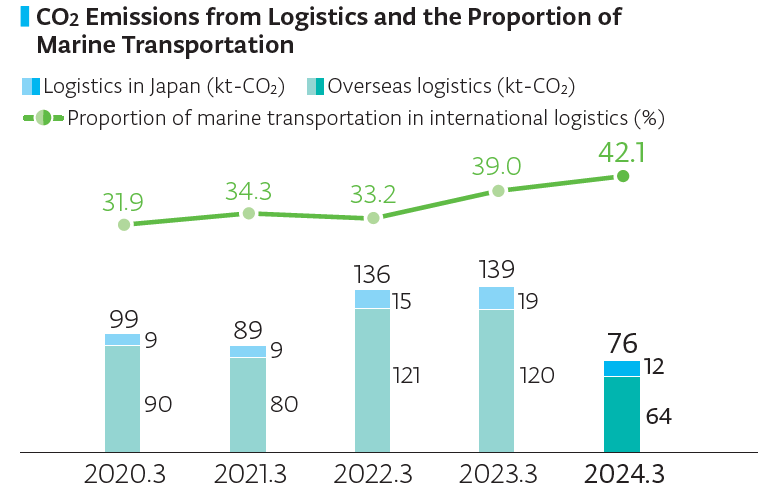
Environmental Impact of Logistics
| FY2022 | FY2023 | FY2024 | FY2025 | FY2026 | ||
|---|---|---|---|---|---|---|
| CO₂ | Emissions (kt-CO₂) | 136 | 139 | 76 | 151 | 110 |
| Japan | 15 | 19 | 12 | 16 | 24 | |
| Overseas | 121 | 120 | 64 | 135 | 86 | |
| Proportion of marine transportation (international) (%) |
33.2 | 39.0 | 42.1 | 50.1 | 41.3 | |
| Use of reinforced cardboard | Reduction in amount of wooden packaging materials used (t) Japan | ー | 2,000 | 1,915 | 3,581 | 4,612 |
Amount of Waste Generated (Entire Group)
| FY2022 | FY2023 | FY2024 | FY2025 | FY2026 | ||
|---|---|---|---|---|---|---|
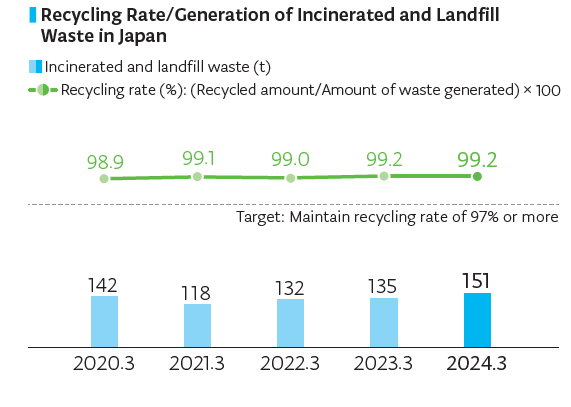
| Waste | Amount generated (t) | 14,459 | 18,249 | 19,714 | 26,618 | 26,007 |
| Japan | 12,921 | 17,047 | 18,527 | 25,310 | 24,587 | |
| Overseas | 1,538 | 1,202 | 1,187 | 1,308 | 1,420 | |
| Recycling | Recycled amount (t) | 14,189 | 17,978 | 19,480 | 26,396 | 25,625 |
| Japan | 12,789 | 16,912 | 18,376 | 25,157 | 24,304 | |
| Overseas | 1,400 | 1,066 | 1,103 | 1,239 | 1,321 | |
| Incinerated and landfill waste | Amount of waste (t) | 270 | 271 | 234 | 222 | 382 |
| Japan | 132 | 135 | 151 | 153 | 284 | |
| Overseas | 138 | 136 | 84 | 69 | 98 | |
| Dangerous/Hazardous waste | Amount generated (t) | 5,231 | 5,634 | 7,743 | 10,664 | 12,021 |
| Japan (Specially controlled industrial waste) |
4,705 | 5,239 | 7,448 | 10,371 | ●11,657 | |
| Overseas (Dangerous/Hazardous waste per country) |
526 | 395 | 296 | 293 | 365 | |
| Dangerous/Hazardous waste recycling | Recycled amount (t) | 5,193 | 5,596 | 7,703 | 10,644 | 12,015 |
| Japan | 4,705 | 5,239 | 7,448 | 10,370 | 11,657 | |
| Overseas | 488 | 357 | 256 | 273 | 359 | |
| Dangerous/Hazardous waste incinerated/landfill waste* | Amount of waste (t) | 38 | 38 | 40 | 21 | 6 |
| Japan | 0 | 0 | 0 | 0 | 0 | |
| Overseas | 38 | 38 | 40 | 20 | 6 | |
In fiscal year 2026, 6 tons were incinerated, and 0 tons were disposed of in landfills after being detoxified.
Chemical Substances Consumption/Emissions (Japan)
| FY2022 | FY2023 | FY2024 | FY2025 | FY2026 | ||
|---|---|---|---|---|---|---|
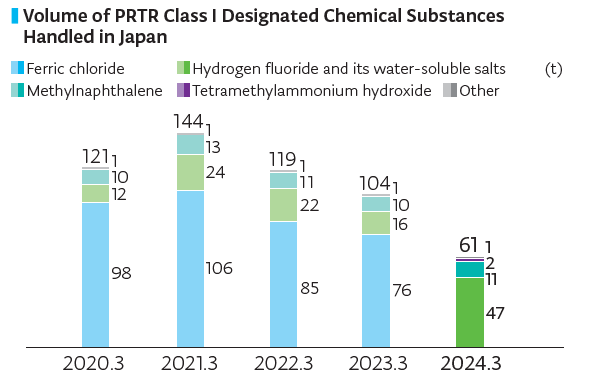
| PRTR Class I designated chemical substances*¹ | Volume handled (t) | 119 | 104 | 61 | 62 | 92 |
| Ferric chloride | 85 | 76 | — | ー | ー | |
| Hydrogen fluoride and its water-soluble salts |
22 | 16 | 47 | 49 | 53 | |
| Methylnaphthalene | 11 | 10 | 11 | 10 | 10 | |
| Tetramethylammonium hydroxide | — | — | 2 | 1 | 1 | |
| VOCs*² | 0.1 | 0.1 | 0.2 | 0.2 | 25 | |
| Other | 1 | 1 | 1 | 1 | 3 | |
| Amount transported (waste amount) (t) |
108 | 94 | 48 | 50 | 55 | |
| Amount transported (sewerage) (t) |
0 | 0 | 2 | 2 | 2 | |
| Consumption (t) | 11 | 10 | 11 | 10 | 35 | |
| NOx | Emissions (t) | 13.1 | 12.7 | 12.9 | 14.8 | 17.4 |
| SOx | Emissions (t) | 4.8 | 4.5 | 4.6 | 4.5 | 4.7 |
Some substances have been added and others eliminated from the scope in accordance with the revision to target substances for fiscal year 2024.
VOCs: Volatile Organic Compounds, amounting to 8 tons of xylene and 17 tons of trimethylbenzene in fiscal year 2026 through use of kerosene as a fuel
Other (Entire Group)
| FY2022 | FY2023 | FY2024 | FY2025 | FY2026 | ||
|---|---|---|---|---|---|---|
| ISO 14001 | Number of certified offices | 11 | 11 | 11 | 11 | 11 |
| Japan | 5 | 5 | 5 | 5 | 5 | |
| Overseas | 6 | 6 | 6 | 6 | 6 | |
| Environmental investments | Environmental investment effects (millions of yen) | 30 | 31 | 16 | 9 | 9 |
| Environmental investment effects (t-CO₂) |
973 | 799 | 334 | 170 | 190 | |
| Biodiversity | Number of ecosystem tours* | 16 | 22 | 20 | 19 | 24 |
| Number of ecosystem tour participants* |
87 | 138 | 289 | 378 | 408 | |
| Environmental laws and regulations | Number of breaches of environmental laws and regulations | 0 | 0 | 0 | 0 | 0 |
| Amount of fines for breaches of laws and regulations | 0 | 0 | 0 | 0 | 0 | |
| Total product shipment (t)* | 41,352 | 48,922 | 35,769 | 46,946 | 44,587 | |
Boundary: Japan