


- Semiconductor Technology Now
Sports Technology Protecting Athletes and Providing Fairer Refereeing
Report Series
All IT tools in place
Over the last five years, awareness about using data to visualize athletes’ conditioning or predict injury has been increasing. Euphoria is trying to provide devices that are easy to use at the actual game venues and can collect meaningful data. Moreover, the company says it wants to link its efforts to awareness-building activities that will improve sports literacy in Japan.
There are three factors behind the trend toward using data-backed sports technology to improve athletes’ physical abilities. First, cloud databases can now be used inexpensively. Second, sensors have become smaller and cheaper and are offering higher accuracy. Third, machine learning services can now be used for analyzing data. The fact that the parts and software used in this framework have become inexpensive has generally played a major role.
However, because companies outside Japan have been strong in all these factors, Japan has been behind in utilizing data. For example, very few Japanese companies have launched products such as positioning devices like the Global Positioning System (GPS) and Global Navigation Satellite System (GNSS), positioning radars that can measure the distance to the other party, and three-dimensional imaging laser devices. There are no Japanese companies among the top 10 sports technology companies in the world. Nevertheless, all hope is not lost because there is little difference between Japan and other countries using the cloud to manage and utilize data.
Optimizing athletes’ conditioning and load
How should data actually be collected, managed, and utilized then? That is the kind of question frequently asked on the One Tap Sports website. However, sports technology is a method and not an objective. That is why the desire to reduce athletic injuries, build a team that can run well, and make the athletes stronger always comes first.
Consulting with Euphoria begins with discussing how sensor devices will be used, including what type will be used and how they will be installed, and then continues to data collection. This objective data is collected, along with subjective data from the athletes who actually undergo training. The coach builds up subjective data by asking the athletes how they are doing. The coach also manually checks their muscle hardness and tension. Data is also collected on athletes’ daily activities, training data, and the conditioning that results from them.
The company’s consulting service has a two-tier fee structure: one for professionals/adults and another for youths, with the service fee per athlete starting at 800 or 300 yen per month, respectively.
Canada began using sports technology to achieve respectable results earlier than Japan. For example, AthleteMonitoring by FITSTATS Technologies, Inc. accumulates clients’ activity data, conditioning data, and the resulting performance data and utilizes them for predicting injury.
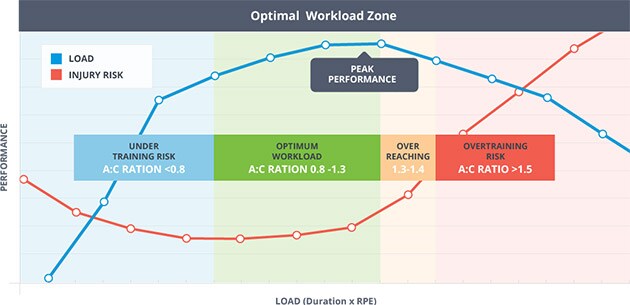
Specifically, an athlete’s status is shown using acute and chronic data (Figure 1). The acute training load means data that appears at this instant following three to seven days of training, while chronic training load means the average workload over the past 21 to 28 days and represents data showing the recent trends. For example, if the acute load is going up sharply, this serves as a warning sign of an increase in injury risk. The company tries to show this kind of data as much as possible without keeping it in a black box. Actually, it is said that increasing the training load by 15% from the preceding weeks will increase the risk of injury by as much as 50%.
 |
For predicting injury, the more data, the better. Therefore, consulting companies say that although they do not want any athlete to suffer an injury, the data being collected when an injury occurred is very precious. It is vital to retain complete data that shows the injury's state, what type of load was being applied, how the athlete was feeling, what data the sensing devices were showing, and the situation under which the injury occurred. Data indicating the type of treatment used during rehabilitation should also be added. Additionally, data indicating whether the injury recurred should also be retained without fail. Accumulating this data and analyzing the differences between periods when no injury occurred and periods when an injury occurred improved prediction accuracy.
Different prescriptions for different sports
Of course, since the data to be collected for volleyball and rugby, for example, will differ completely, the prescriptions for their respective athletes will also be completely different. For example, volleyball requires data on jumps, their heights, and their number, etc. The body part at the highest risk of injury is the knee because the knee is subject to strong shocks during landing. On the other hand, data collected for rugby covers the distance run, the number of tackles, acceleration, and deceleration, etc.
Some sports are played over league seasons, while others are played in short-term tournaments; thus, performance optimization approaches will naturally differ. In professional baseball, games are played from April to October or November. Player condition peaks in April, and the ability to keep this peak state throughout the season until October becomes crucial. In contrast, in the tournament style, such as the Rugby World Cup, players try to bring their condition to its peak in preparation for matches. They try to synchronize their peak condition with upcoming games. Once the games are over, the players rapidly drop their training load and go into recovery mode. Then, they try to bring their condition up again gradually. Tournaments involve repetitions of this process. And since it is necessary to create the same conditions at the same location in order to win, it becomes important for the players to try themselves out at the actual tournament location one year in advance.
Contents
Cross Talk
Visiting Laboratories
Expert Interview
Topics
Report Series

- Motorization, Act II – The Age of Automated Driving

- How Society Will Change in the Digital Age
- Part 1
- What is Digitalization?

- Sports Technology Protecting Athletes and Providing Fairer Refereeing