


- Semiconductor Technology Now
Sports Technology Protecting Athletes and Providing Fairer Refereeing
Report Series
Utilizing fluid dynamics
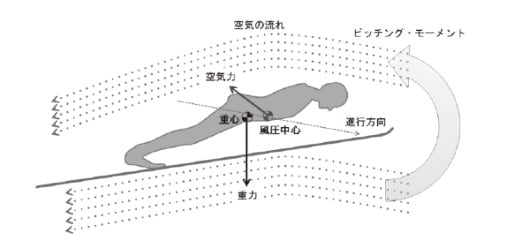
The suitability of the wide variety of available technologies varies depending on the specific sports field. In ski jumping, simulations based on fluid dynamics have long been used. Ski jumping demands that competitors achieve the longest jump possible in a graceful form. When gliding down from the starting point, competitors try to maintain as fast a speed as possible before taking off from the take-off table. Although they can only descend after take-off, they try to extend their jump distance by remaining airborne, riding the buoyancy as long as possible (Figure 1).
 |
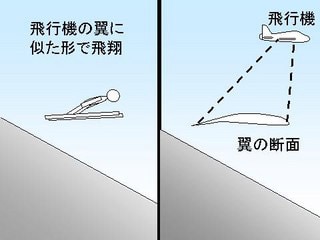 |
The optimal posture conditions for this purpose are, first, a posture that reduces air resistance leading up to the take-off table and then a posture that increases buoyancy after take-off. The air flow ideal for these two postures is determined by solving fluid dynamics equations. This requires solving a three-dimensional equation rather than a simple planar two-dimensional equation. As a result, the present-day style has evolved in which the jumper maintains a crouching posture with both arms extended rearward up to the take-off table and then keeps a V-shaped posture in which the body is tilted forward nearly parallel to the skis.
Visualizing the air resistance
Fluid dynamics can be used to express and visualize how air flows act on the human body. Visualization can be achieved using lines to express air flows or using colors to express thinner and denser air. In speed skating and short-distance bicycle racing, fluid dynamics simulations have come to visually demonstrate that the leading racers are subjected to the strongest wind and expend energy.
In the past, postures with the least air resistance were determined using a wind tunnel experiment, in which a giant fan was used to create wind to check air flows visually. More recently, however, numerical computations using supercomputers and high-performance computing (HPC) are able to visualize air flows. The optimum posture can be determined by varying the posture orientation and computing the posture that receives the least air resistance.
Utilizing AI and machine learning
Recently AI, especially data analysis using machine learning, has received a lot of attention. In machine learning, once a computer learns various patterns, it can recognize and classify even new patterns without being explicitly programmed by people to do so.
What can we accomplish if we apply this machine learning to sports? One example can be seen in baseball. Ray Hensberger is an engineer in the Strategic Innovation Group at Booz Allen Hamilton Inc., a U.S. solution provider involved in data security, data analysis, and consulting, etc. Hensberger accumulated and analyzed data on pitch types by the major pitchers in the Major League during three seasons (Reference 1). The cumulative total number of pitchers he analyzed is said to have reached 900 over the three seasons. He modeled this data and used machine learning to classify the data characteristics.
As a result, the computer learned to predict pitch types, such as four-seam fastballs, curveballs, and sliders, of 400 pitches at an accuracy of 74.5%. The data he had the computer learn included the number of players on base when the pitch was made, whether the pitcher was a right- or left-hander, the status of the game’s progress, the releasing position of curveballs, the speed of fastballs, the pitch selection, and the movement of sliders. To validate the learning model and improve the learning precision, he said he checked the learning model's effectiveness while repeating mutual checking.
Although not for the purpose of strengthening athletes, IBM has used Watson, a computer dedicated to machine learning, to make it possible to automatically edit highlight scenes from tennis matches on as many as 18 courts in only two minutes. Here, the computer recognizes signals that make scenes highlights from such images as the audience's excitement, the match-deciding final scene, and player gestures. For example, Watson recognizes images showing a service ace, a player making a victory pose, and players’ gesture of widely opening their mouths and showing their teeth as highlight images and classifies them as highlight scenes (Reference 2).
Using Bluetooth beacon to improve athlete’s positional accuracy
AI is not the only recent technology used in sports. The use of IoT in various applications has also been increasing. For example, if a Global Positioning System (GPS) is attached to athletes’ clothing, it becomes possible to track individual players’ behaviors. This is surely a useful method, especially in sports that have 10 or more players per team, such as soccer and rugby. However, sensors alone cannot perform analyses. Using sensors together with technologies such as AI that can analyze the collected data is a powerful combination.
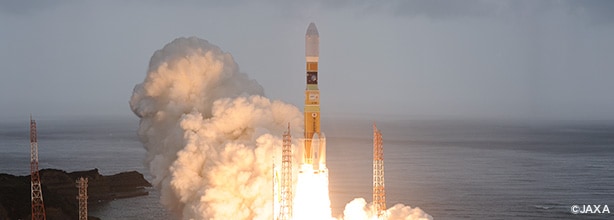
However, GPS accuracy is still too low to accurately determine an athlete’s location. Using GPS alone results in positional errors of around ±10 m. Using a Differential GPS (DGPS) method, however, in which a base station is installed that [References] GPS signals and the difference between the signals from this reference station and the GPS is determined, can shrink the positional errors to around ±2 m. Nevertheless, even this is not enough to precisely determine the athlete’s location. To be useful, the error must be reduced to the centimeter range. The advent of a Global Navigation Satellite System (GNSS), which is replacing GPS, could reduce the errors to tens of centimeters. However, sufficient positional accuracy would not be possible to obtain unless at least four position-measuring satellites were launched because simultaneous equations with four variables must be solved.
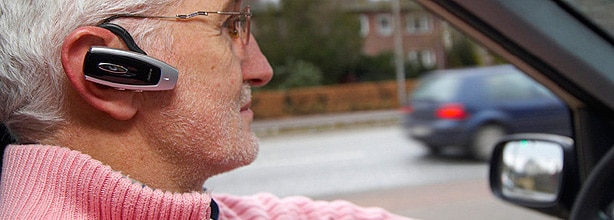
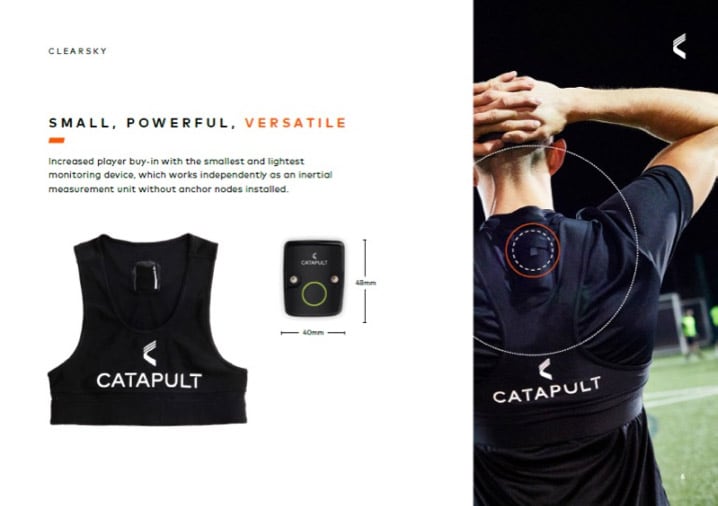
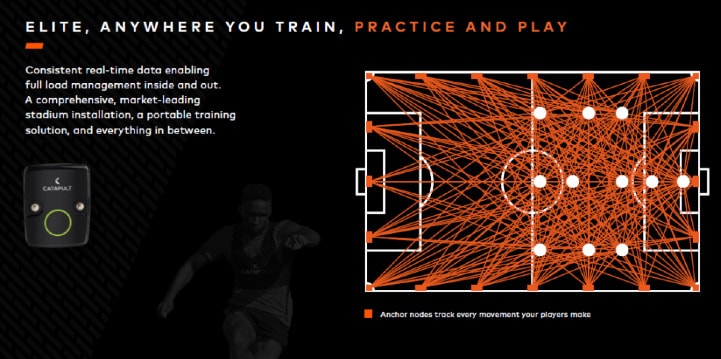
Therefore, Catapult Sports of Australia has created a device to clearly visualize individual athletes’ behaviors in team sports, such as soccer and rugby. About half the size of a smartphone, this device is inserted into a pocket provided on the back of the athlete’s clothing (Figure 2) to visualize their behavior.
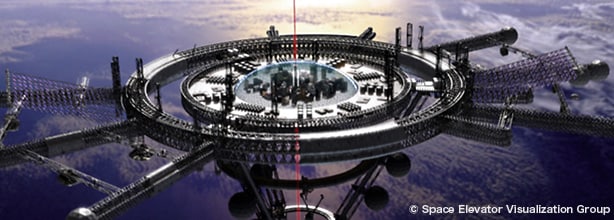
The Bluetooth signals from the devices worn by the athletes are received using the many Bluetooth beacon receivers (Figure 3) installed surrounding the stadium, and the athletes’ movements and positions are calculated from the intensity of these signals. While the accuracy obtained with GPS is poor, this Bluetooth beacon method is said to show an athlete’s position with errors of around 10 cm.
 |
 |
Since this device contains an accelerometer, it can also show the athlete’s physical activity level. Each player’s movements are tracked on a real-time basis, and video analysis is also used to collect, manage (link), save, and analyze data such as how the player moved and passed the ball and how he or she kicked the ball trying to score. This tracking is done on a cloud basis, and a player can then be replaced when his or her movements become sluggish.
Contents
Cross Talk
Visiting Laboratories
Expert Interview
Topics
Report Series
- Motorization, Act II – The Age of Automated Driving

- How Society Will Change in the Digital Age
- Part 1
- What is Digitalization?

- Sports Technology Protecting Athletes and Providing Fairer Refereeing